Advance Auto Parts 2014 Annual Report Download - page 54
Download and view the complete annual report
Please find page 54 of the 2014 Advance Auto Parts annual report below. You can navigate through the pages in the report by either clicking on the pages listed below, or by using the keyword search tool below to find specific information within the annual report.-
 1
1 -
2
-
3
-
4
-
5
-
6
-
7
-
8
-
9
-
10
-
11
-
12
-
13
-
14
-
15
-
16
-
17
-
18
-
19
-
20
-
21
-
22
-
23
-
24
-
25
-
26
-
27
-
28
-
29
-
30
-
31
-
32
-
33
-
34
-
35
-
36
-
37
-
38
-
39
-
40
-
41
-
42
-
43
-
 44
44 -
 45
45 -
 46
46 -
 47
47 -
 48
48 -
 49
49 -
 50
50 -
 51
51 -
 52
52 -
 53
53 -
 54
54 -
 55
55 -
 56
56 -
 57
57 -
 58
58 -
 59
59 -
 60
60 -
 61
61 -
 62
62 -
 63
63 -
 64
64 -
65
-
66
-
67
-
68
-
69
-
70
-
71
-
72
-
73
-
74
-
75
-
76
-
77
-
78
-
79
-
80
-
81
-
82
-
83
-
84
-
85
-
86
-
87
-
88
-
89
-
90
-
91
-
92
-
93
-
94
-
95
-
96
-
97
-
98
-
99
-
100
 |
 |

F-7
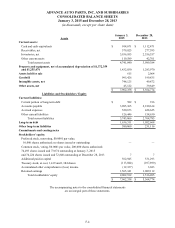
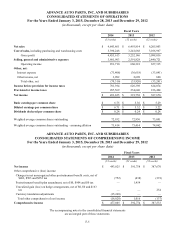
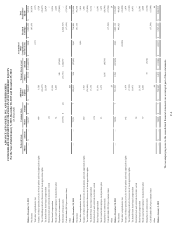
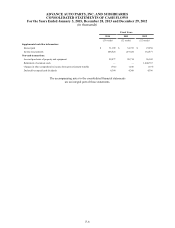
ADVANCE AUTO PARTS, INC. AND SUBSIDIARIES
CONSOLIDATED STATEMENTS OF CASH FLOWS
For the Years Ended January 3, 2015, December 28, 2013 and December 29, 2012
(in thousands)
Fiscal Years
2014 2013 2012
(53 weeks) (52 weeks) (52 weeks)
Cash flows from operating activities:
Net income $ 493,825 $ 391,758 $ 387,670
Adjustments to reconcile net income to net cash provided by operating
activities:
Depreciation and amortization 284,693 207,795 189,544
Share-based compensation 21,705 13,191 15,236
Loss on property and equipment, net 13,281 1,599 2,699
Other 2,631 1,679 1,582
Provision (benefit) for deferred income taxes 48,468 (2,237) 26,893
Excess tax benefit from share-based compensation (10,487) (16,320) (23,099)
Net (increase) decrease in, net of effect from acquisition of businesses:
Receivables, net (48,209) (32,428) (89,482)
Inventories, net (227,657) (203,513) (260,298)
Other assets (63,482) 11,011 8,213
Net increase (decrease) in, net of effect from acquisition of businesses:
Accounts payable 216,412 113,497 376,631
Accrued expenses (28,862) 63,346 40,936
Other liabilities 6,673 (4,128) 8,756
Net cash provided by operating activities 708,991 545,250 685,281
Cash flows from investing activities:
Purchases of property and equipment (228,446) (195,757) (271,182)
Business acquisitions, net of cash acquired (2,060,783) (186,137) (8,369)
Sale of certain assets of acquired business — 19,042 —
Proceeds from sales of property and equipment 992 745 6,573
Net cash used in investing activities (2,288,237) (362,107) (272,978)
Cash flows from financing activities:
Increase (decrease) in bank overdrafts 16,219 (2,926) (7,459)
Issuance of senior unsecured notes — 448,605 299,904
Payment of debt related costs — (8,815) (2,942)
Borrowings under credit facilities 2,238,200 — 58,500
Payments on credit facilities (1,654,800) — (173,500)
Dividends paid (17,580) (17,574) (17,596)
Proceeds from the issuance of common stock, primarily exercise of stock
options 6,578 3,611 8,495
Tax withholdings related to the exercise of stock appreciation rights (7,102) (21,856) (26,677)
Excess tax benefit from share-based compensation 10,487 16,320 23,099
Repurchase of common stock (5,154) (80,795) (27,095)
Contingent consideration related to previous business acquisition (10,047) (4,726) (10,911)
Other (890) (627) 4,089
Net cash provided by financing activities 575,911 331,217 127,907
Effect of exchange rate changes on cash (4,465) — —
Net (decrease) increase in cash and cash equivalents (1,007,800) 514,360 540,210
Cash and cash equivalents, beginning of period 1,112,471 598,111 57,901
Cash and cash equivalents, end of period $ 104,671 $ 1,112,471 $ 598,111