Advance Auto Parts 2014 Annual Report Download - page 34
Download and view the complete annual report
Please find page 34 of the 2014 Advance Auto Parts annual report below. You can navigate through the pages in the report by either clicking on the pages listed below, or by using the keyword search tool below to find specific information within the annual report.-
 1
1 -
2
-
3
-
4
-
5
-
6
-
7
-
8
-
9
-
10
-
11
-
12
-
13
-
14
-
15
-
16
-
17
-
18
-
19
-
20
-
21
-
22
-
23
-
 24
24 -
 25
25 -
 26
26 -
 27
27 -
 28
28 -
 29
29 -
 30
30 -
 31
31 -
 32
32 -
 33
33 -
 34
34 -
 35
35 -
 36
36 -
 37
37 -
 38
38 -
 39
39 -
 40
40 -
 41
41 -
 42
42 -
 43
43 -
 44
44 -
45
-
46
-
47
-
48
-
49
-
50
-
51
-
52
-
53
-
54
-
55
-
56
-
57
-
58
-
59
-
60
-
61
-
62
-
63
-
64
-
65
-
66
-
67
-
68
-
69
-
70
-
71
-
72
-
73
-
74
-
75
-
76
-
77
-
78
-
79
-
80
-
81
-
82
-
83
-
84
-
85
-
86
-
87
-
88
-
89
-
90
-
91
-
92
-
93
-
94
-
95
-
96
-
97
-
98
-
99
-
100
 |
 |

27
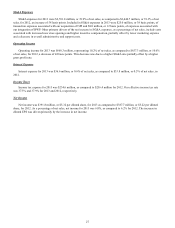
SG&A Expenses
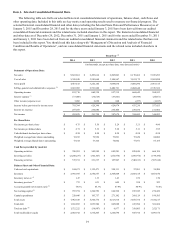
SG&A expenses for 2013 were $2,591.8 million, or 39.9% of net sales, as compared to $2,440.7 million, or 39.3% of net
sales, for 2012, an increase of 58 basis points. Included in SG&A expenses in 2013 were $25.0 million, or 38 basis points, of
transaction expenses associated with our acquisition of GPI and $8.0 million, or 12 basis points, of expenses associated with
our integration of BWP. Other primary drivers of the net increase in SG&A expenses, as a percentage of net sales, include costs
associated with increased new store openings and higher incentive compensation, partially offset by lower marketing expense
and a decrease in overall administrative and support costs.
Operating Income
Operating income for 2013 was $660.3 million, representing 10.2% of net sales, as compared to $657.3 million, or 10.6%
of net sales, for 2012, a decrease of 42 basis points. This decrease was due to a higher SG&A rate partially offset by a higher
gross profit rate.
Interest Expense
Interest expense for 2013 was $36.6 million, or 0.6% of net sales, as compared to $33.8 million, or 0.5% of net sales, in
2012.
Income Taxes
Income tax expense for 2013 was $234.6 million, as compared to $236.4 million for 2012. Our effective income tax rate
was 37.5% and 37.9% for 2013 and 2012, respectively.
Net Income
Net income was $391.8 million, or $5.32 per diluted share, for 2013 as compared to $387.7 million, or $5.22 per diluted
share, for 2012. As a percentage of net sales, net income for 2013 was 6.0%, as compared to 6.2% for 2012. The increase in
diluted EPS was driven primarily by the increase in net income.