Advance Auto Parts 2014 Annual Report Download - page 84
Download and view the complete annual report
Please find page 84 of the 2014 Advance Auto Parts annual report below. You can navigate through the pages in the report by either clicking on the pages listed below, or by using the keyword search tool below to find specific information within the annual report.-
 1
1 -
2
-
3
-
4
-
5
-
6
-
7
-
8
-
9
-
10
-
11
-
12
-
13
-
14
-
15
-
16
-
17
-
18
-
19
-
20
-
21
-
22
-
23
-
24
-
25
-
26
-
27
-
28
-
29
-
30
-
31
-
32
-
33
-
34
-
35
-
36
-
37
-
38
-
39
-
40
-
41
-
42
-
43
-
44
-
45
-
46
-
47
-
48
-
49
-
50
-
51
-
52
-
53
-
54
-
55
-
56
-
57
-
58
-
59
-
60
-
61
-
62
-
63
-
64
-
65
-
66
-
67
-
68
-
69
-
70
-
71
-
72
-
73
-
 74
74 -
 75
75 -
 76
76 -
 77
77 -
 78
78 -
 79
79 -
 80
80 -
 81
81 -
 82
82 -
 83
83 -
 84
84 -
 85
85 -
 86
86 -
 87
87 -
 88
88 -
 89
89 -
 90
90 -
 91
91 -
 92
92 -
 93
93 -
 94
94 -
95
-
96
-
97
-
98
-
99
-
100
 |
 |

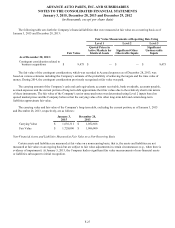
ADVANCE AUTO PARTS, INC. AND SUBSIDIARIES
NOTES TO THE CONSOLIDATED FINANCIAL STATEMENTS
January 3, 2015, December 28, 2013 and December 29, 2012
(in thousands, except per share data)
F-37
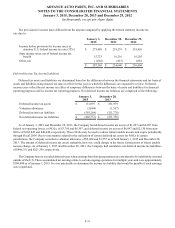
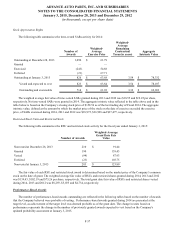
Stock Appreciation Rights
The following table summarizes the time-vested SARs activity for 2014:
Number of
Awards
Weighted-
Average
Exercise Price
Weighted-
Average
Remaining
Contractual
Term (in years)
Aggregate
Intrinsic Value
Outstanding at December 28, 2013 1,090 $ 61.79
Granted — —
Exercised (243) 54.88
Forfeited (21) 67.71
Outstanding at January 3, 2015 826 $ 63.68 3.54 $ 78,332
Vested and expected to vest 823 $ 63.64 3.54 $ 78,107
Outstanding and exercisable 714 $ 61.92 3.32 $ 69,033
The weighted average fair value of time-vested SARs granted during 2013 and 2012 was $18.55 and $19.25 per share,
respectively. No time-vested SARs were granted in 2014. The aggregate intrinsic value reflected in the table above and in the
table below is based on the Company’s closing stock price of $158.56 as of the last trading day of Fiscal 2014. The aggregate
intrinsic value, defined as the amount by which the market price of the stock on the date of exercise exceeded the exercise
price, of SARs exercised during 2014, 2013 and 2012 was $18,975, $36,998 and $37,477, respectively.
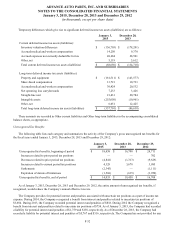
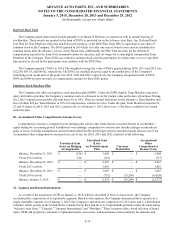
Restricted Stock Units and Restricted Stock
The following table summarizes the RSU and restricted stock activity for the fiscal year ended January 3, 2015:
Number of Awards
Weighted-Average
Grant Date Fair
Value
Nonvested at December 28, 2013 210 $ 91.44
Granted 190 139.43
Vested (94) 87.93
Forfeited (23) 103.75
Nonvested at January 3, 2015 283 $ 123.89
The fair value of each RSU and restricted stock award is determined based on the market price of the Company’s common
stock on the date of grant. The weighted average fair value of RSUs and restricted shares granted during 2014, 2013 and 2012
was $139.43, $102.19 and $75.26 per share, respectively. The total grant date fair value of RSUs and restricted shares vested
during 2014, 2013 and 2012 was $8,293, $5,035 and $4,734, respectively.
Performance-Based Awards
The number of performance-based awards outstanding are reflected in the following tables based on the number of awards
that the Company believed were probable of vesting. Performance-based awards granted during 2014 are presented at the
target level, as achievement of the target level was deemed probable as of the grant date. The change in units based on
performance represents the change in the number of previously granted awards expected to vest based on the Company's
updated probability assessment at January 3, 2015.