Advance Auto Parts 2014 Annual Report Download - page 2
Download and view the complete annual report
Please find page 2 of the 2014 Advance Auto Parts annual report below. You can navigate through the pages in the report by either clicking on the pages listed below, or by using the keyword search tool below to find specific information within the annual report.-
 1
1 -
 2
2 -
 3
3 -
 4
4 -
 5
5 -
 6
6 -
 7
7 -
 8
8 -
 9
9 -
 10
10 -
 11
11 -
 12
12 -
 13
13 -
14
-
15
-
16
-
17
-
18
-
19
-
20
-
21
-
22
-
23
-
24
-
25
-
26
-
27
-
28
-
29
-
30
-
31
-
32
-
33
-
34
-
35
-
36
-
37
-
38
-
39
-
40
-
41
-
42
-
43
-
44
-
45
-
46
-
47
-
48
-
49
-
50
-
51
-
52
-
53
-
54
-
55
-
56
-
57
-
58
-
59
-
60
-
61
-
62
-
63
-
64
-
65
-
66
-
67
-
68
-
69
-
70
-
71
-
72
-
73
-
74
-
75
-
76
-
77
-
78
-
79
-
80
-
81
-
82
-
83
-
84
-
85
-
86
-
87
-
88
-
89
-
90
-
91
-
92
-
93
-
94
-
95
-
96
-
97
-
98
-
99
-
100
 |
 |
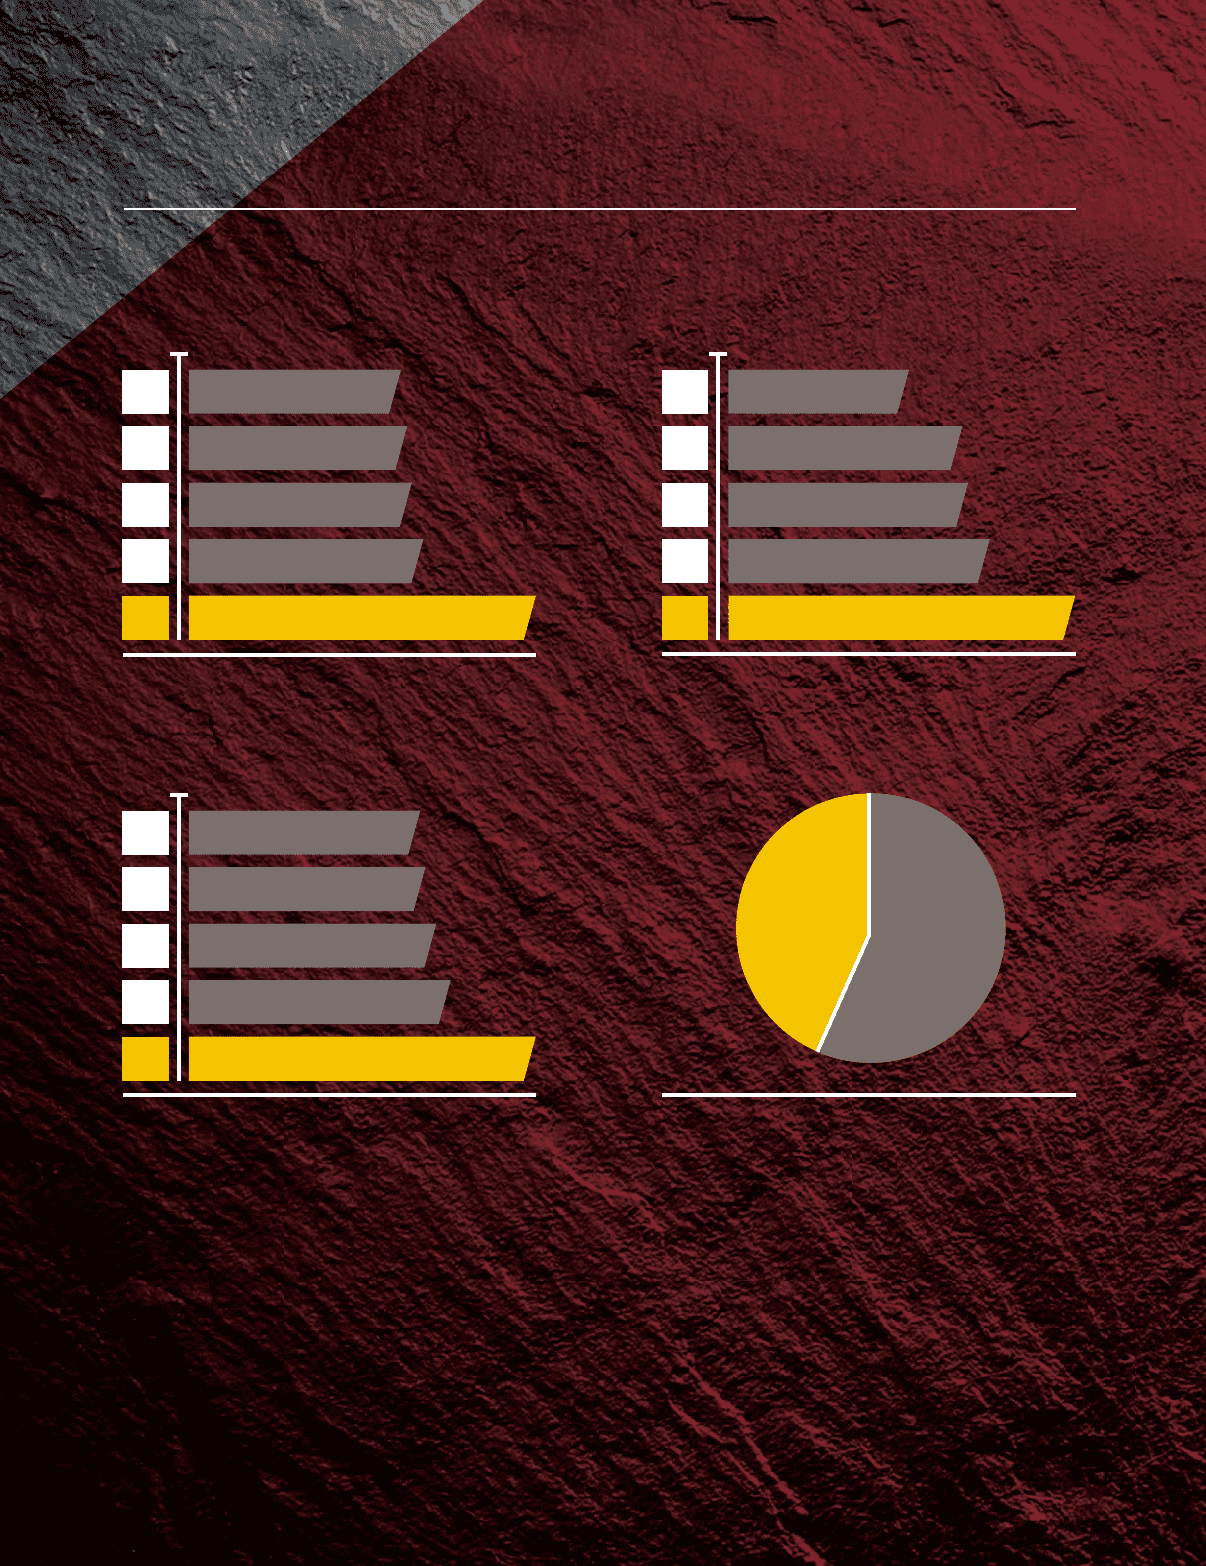
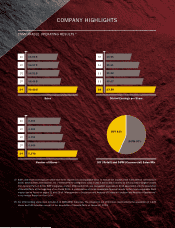
COMPANY HIGHLIGHTS
COMPARABLE OPERATING RESULTS (1)
Sales and diluted earnings per share have been reported on a comparable basis to exclude the impact of the 53rd week of operations in
2014; General Parts International, Inc. (“General Parts”) integration costs in 2014, amortization related to the acquired intangible assets
from General Parts in 2014; BWP integration costs in 2014 and 2013; and transaction expenses in 2013 associated with the acquisition
of General Parts at the beginning of our Fiscal 2014. A reconciliation of these comparable nancial results to the most comparable GAAP
results can be found on pages 21 and 28 of “Management’s Discussion and Analysis of Financial Condition and Results of Operations”
in our Annual Report on Form 10-K.
Our 2014 ending store count includes 111 WORLDPAC branches. The increase in our 2014 store count reects the acquisition of 1,233
stores and 103 branches as part of our acquisition of General Parts on January 2, 2014.
10
10
10
11
11
11
12
12
12
13
13
13
14
14
14
$5.93 B $3.95
$6.17 B $5.11
$6.21 B $5.22
$6.49 B $5.67
$9.69 B $7.59
Sales
Number of Stores
(2)
Diluted Earnings per Share
DIY (Retail) and DIFM (Commercial) Sales Mix
DIFM 57%
DIY 43%
(1)
(2)
3,563
3,662
3,794
4,049
5,372