Advance Auto Parts 2014 Annual Report Download - page 28
Download and view the complete annual report
Please find page 28 of the 2014 Advance Auto Parts annual report below. You can navigate through the pages in the report by either clicking on the pages listed below, or by using the keyword search tool below to find specific information within the annual report.-
 1
1 -
2
-
3
-
4
-
5
-
6
-
7
-
8
-
9
-
10
-
11
-
12
-
13
-
14
-
15
-
16
-
17
-
 18
18 -
 19
19 -
 20
20 -
 21
21 -
 22
22 -
 23
23 -
 24
24 -
 25
25 -
 26
26 -
 27
27 -
 28
28 -
 29
29 -
 30
30 -
 31
31 -
 32
32 -
 33
33 -
 34
34 -
 35
35 -
 36
36 -
 37
37 -
 38
38 -
39
-
40
-
41
-
42
-
43
-
44
-
45
-
46
-
47
-
48
-
49
-
50
-
51
-
52
-
53
-
54
-
55
-
56
-
57
-
58
-
59
-
60
-
61
-
62
-
63
-
64
-
65
-
66
-
67
-
68
-
69
-
70
-
71
-
72
-
73
-
74
-
75
-
76
-
77
-
78
-
79
-
80
-
81
-
82
-
83
-
84
-
85
-
86
-
87
-
88
-
89
-
90
-
91
-
92
-
93
-
94
-
95
-
96
-
97
-
98
-
99
-
100
 |
 |
21
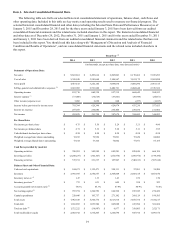
Item 7. Management’s Discussion and Analysis of Financial Condition and Results of Operations.
The following discussion and analysis of financial condition and results of operations should be read in conjunction with
“Selected Consolidated Financial Data,” our consolidated historical financial statements and the notes to those statements
that appear elsewhere in this report. Our discussion contains forward-looking statements based upon current expectations that
involve risks and uncertainties, such as our plans, objectives, expectations and intentions. Actual results and the timing of
events could differ materially from those anticipated in these forward-looking statements as a result of a number of factors,
including those set forth under the sections entitled “Forward-Looking Statements” and “Risk Factors” elsewhere in this
report.
Our fiscal year ends on the Saturday nearest December 31st of each year, which results in an extra week every several
years (fiscal 2014 contained 53 weeks). Our first quarter consists of 16 weeks, and the other three quarters consist of 12 weeks,
with the exception of the fourth quarter of fiscal 2014 which contained 13 weeks due to our 53-week fiscal year in 2014. Our
last 53-week fiscal year was in 2008.
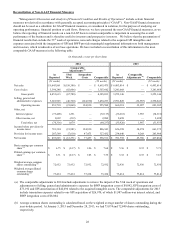
Unless otherwise noted, our financial results have been presented on a GAAP basis. In limited instances, we have
presented our financial results on a GAAP and non-GAAP (comparable) basis which is described further in the section entitled
"Reconciliation of Non-GAAP Financial Measures."
Introduction
We are the largest automotive aftermarket parts provider in North America, serving both "do-it-for-me", or Commercial,
and "do-it-yourself", or DIY, customers. As of January 3, 2015 we operated a total of 5,261 stores and 111 distribution
branches. We operated primarily within the United States, with additional locations in Canada, Puerto Rico and the U.S. Virgin
Islands. Our stores operate primarily under trade names "Advance Auto Parts", "Autopart International" and "Carquest" and
our distribution branches operate under the "Worldpac" trade name. In addition, we served approximately 1,325 independently-
owned Carquest stores as of January 3, 2015. We acquired the Carquest and Worldpac operations as part of our acquisition of
GPI on January 2, 2014.
Our stores and branches offer a broad selection of brand name, OEM and private label automotive replacement parts,
accessories, batteries, and maintenance items for domestic and imported cars, vans, sport utility vehicles and light and heavy
duty trucks. Through our integrated operating approach, we serve our Commercial and DIY customers from our store locations
and online at www.AdvanceAutoParts.com, www.Carquest.com and www.Worldpac.com. Our DIY customers can elect to pick
up merchandise ordered online at a conveniently located store or have their purchases shipped directly to them. Our
Commercial customers consist primarily of delivery customers for whom we deliver products from our store locations to our
Commercial customers’ places of business, including independent garages, service stations and auto dealers. Our Commercial
customers can also conveniently place their orders online.
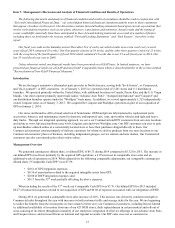
Management Overview
We generated earnings per diluted share, or diluted EPS, of $6.71 during 2014 compared to $5.32 for 2013. The increase in
our diluted EPS was driven primarily by the acquired GPI operations, a 2.0% increase in comparable store sales and an
additional week of operations in 2014. When adjusted for the following comparable adjustments, our comparable earnings per
diluted share ("Comparable Cash EPS") was $7.59:
• $0.61 of GPI integration expenses;
• $0.36 of amortization related to the acquired intangible assets from GPI;
• $0.08 of BWP integration expenses; and
• $0.17 from the 53rd week partially offsetting the above expenses.
When including the results of the 53rd week, our Comparable Cash EPS was $7.76. Our diluted EPS for 2013 included
$0.27 of transaction expenses related to our acquisition of GPI and $0.08 of expenses associated with our integration of BWP.
During 2014 we generated a comparable store sales increase of 2.0%. This increase was driven by consistent strength in
Commercial sales throughout the year with increases in both customer traffic and average ticket for the year. We are beginning
to realize the benefits from the investments we have made to better serve our Commercial customers, including but not limited
to, additional availability of inventory from one of our 421 HUB stores, daily replenishment in certain markets and roll-out of
cross-sourcing of inventory throughout a majority of our enterprise; integration of eService offerings in our Advance Auto Parts
and Carquest stores; and increased focus on national and regional accounts. Our DIY sales were not as consistent as