Advance Auto Parts 2014 Annual Report Download - page 35
Download and view the complete annual report
Please find page 35 of the 2014 Advance Auto Parts annual report below. You can navigate through the pages in the report by either clicking on the pages listed below, or by using the keyword search tool below to find specific information within the annual report.-
 1
1 -
2
-
3
-
4
-
5
-
6
-
7
-
8
-
9
-
10
-
11
-
12
-
13
-
14
-
15
-
16
-
17
-
18
-
19
-
20
-
21
-
22
-
23
-
24
-
 25
25 -
 26
26 -
 27
27 -
 28
28 -
 29
29 -
 30
30 -
 31
31 -
 32
32 -
 33
33 -
 34
34 -
 35
35 -
 36
36 -
 37
37 -
 38
38 -
 39
39 -
 40
40 -
 41
41 -
 42
42 -
 43
43 -
 44
44 -
 45
45 -
46
-
47
-
48
-
49
-
50
-
51
-
52
-
53
-
54
-
55
-
56
-
57
-
58
-
59
-
60
-
61
-
62
-
63
-
64
-
65
-
66
-
67
-
68
-
69
-
70
-
71
-
72
-
73
-
74
-
75
-
76
-
77
-
78
-
79
-
80
-
81
-
82
-
83
-
84
-
85
-
86
-
87
-
88
-
89
-
90
-
91
-
92
-
93
-
94
-
95
-
96
-
97
-
98
-
99
-
100
 |
 |
28
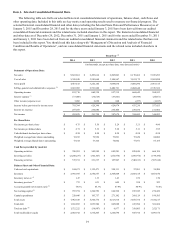
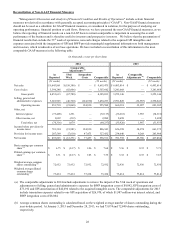
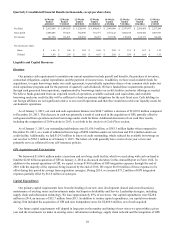
Reconciliation of Non-GAAP Financial Measures
"Management’s Discussion and Analysis of Financial Condition and Results of Operations" include certain financial
measures not derived in accordance with generally accepted accounting principles (“GAAP”). Non-GAAP financial measures
should not be used as a substitute for GAAP financial measures, or considered in isolation, for the purpose of analyzing our
operating performance, financial position or cash flows. However, we have presented the non-GAAP financial measures, as we
believe the reporting of financial results on a non-GAAP basis to remain comparable is important in assessing the overall
performance of the business and is therefore useful to investors and prospective investors. We believe that the presentation of
financial results that exclude the 53rd week of operations, non-cash charges related to the acquired GPI intangibles and
expenses associated with the integration of GPI and BWP provide meaningful supplemental information to both management
and investors, which is indicative of our base operations. We have included a reconciliation of this information to the most
comparable GAAP measures in the following table.
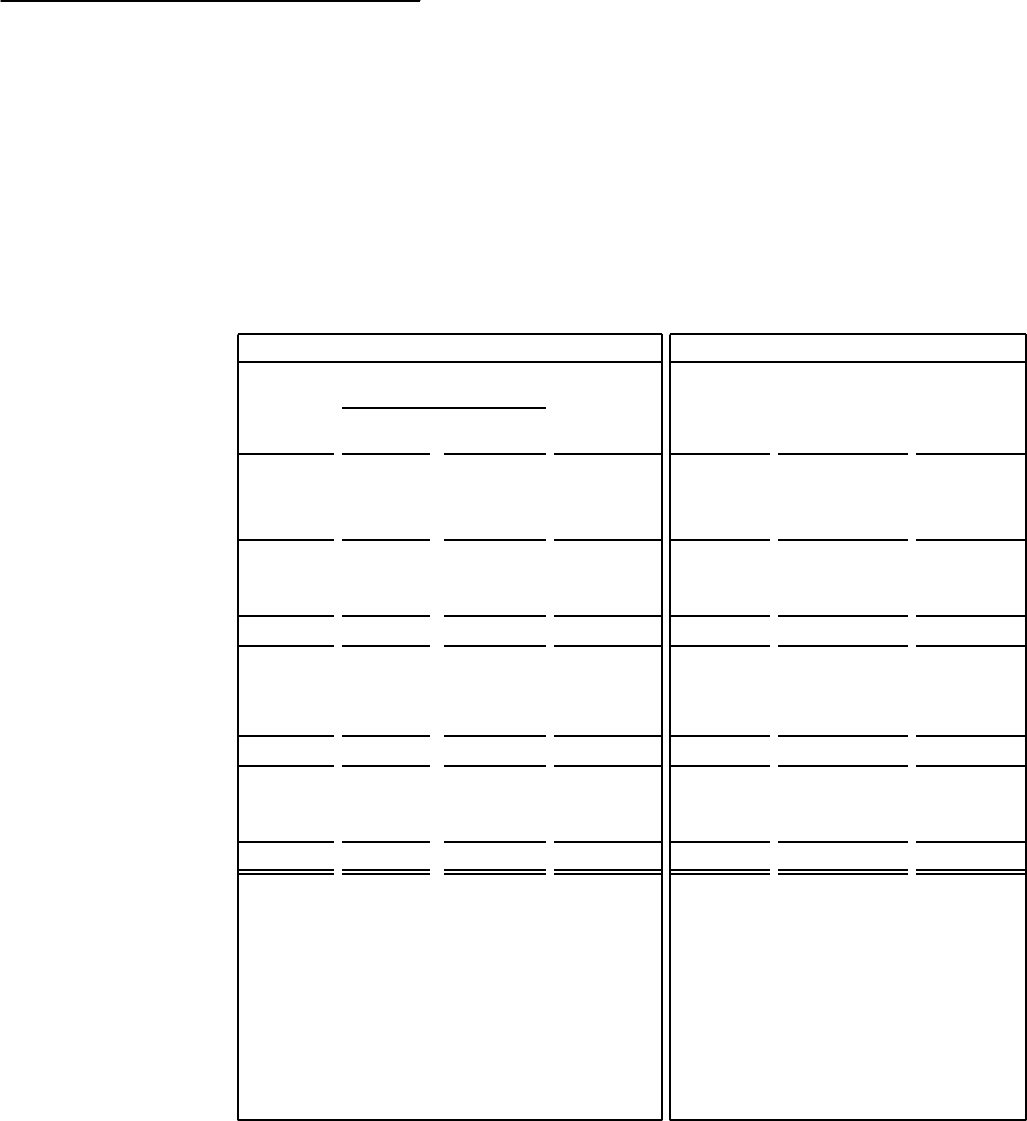
(in thousands, except per share data)
2014 2013
Comparable
Adjustments (a)
As
Reported
53rd
Week
Integration
Costs Comparable
As
Reported
Comparable
Adjustments (a) Comparable
(53 weeks) (52 weeks) (52 weeks) (52 weeks)
Net sales $ 9,843,861 $ (150,386) $ — $ 9,693,475 $ 6,493,814 $ — $ 6,493,814
Cost of sales 5,390,248 (82,606) — 5,307,642 3,241,668 — 3,241,668
Gross profit 4,453,613 (67,780) — 4,385,833 3,252,146 — 3,252,146
Selling, general and
administrative expenses 3,601,903 (46,720) (124,930) 3,430,253 2,591,828 (32,987) 2,558,841
Operating income 851,710 (21,060) 124,930 955,580 660,318 32,987 693,305
Other, net:
Interest expense (73,408) 1,291 — (72,117) (36,618) 1,987 (34,631)
Other income, net 3,092 (212) — 2,880 2,698 — 2,698
Total other, net (70,316) 1,079 — (69,237) (33,920) 1,987 (31,933)
Income before provision for
income taxes 781,394 (19,981) 124,930 886,343 626,398 34,974 661,372
Provision for income taxes 287,569 (7,610) 47,473 327,432 234,640 9,268 243,908
Net income $ 493,825 $ (12,371) $ 77,457 $ 558,911 $ 391,758 $ 25,706 $ 417,464
Basic earnings per common
share (b) $ 6.75 $ (0.17) $ 1.06 $ 7.64 $ 5.36 $ 0.35 $ 5.71
Diluted earnings per common
share (b) $ 6.71 $ (0.17) $ 1.05 $ 7.59 $ 5.32 $ 0.35 $ 5.67
Weighed average common
shares outstanding (b) 72,932 72,932 72,932 72,932 72,930 72,930 72,930
Weighted average diluted
common shares
outstanding (b) 73,414 73,414 73,414 73,414 73,414 73,414 73,414
(a) The comparable adjustments to 2014 include adjustments to remove the impact of the 53rd week of operations and
adjustments to Selling, general and administrative expenses for BWP integration costs of $9,042, GPI integration costs of
$73,192 and GPI amortization of $42,696 related to the acquired intangible assets. The comparable adjustments for 2013
include transaction expenses related to our GPI acquisition of $26,970, of which $1,987 million was interest related, and
BWP integration costs of $8,004.
(b) Average common shares outstanding is calculated based on the weighted average number of shares outstanding during the
year-to-date period. At January 3, 2015 and December 28, 2013, we had 73,074 and 72,840 shares outstanding,
respectively.