Advance Auto Parts 2014 Annual Report Download - page 31
Download and view the complete annual report
Please find page 31 of the 2014 Advance Auto Parts annual report below. You can navigate through the pages in the report by either clicking on the pages listed below, or by using the keyword search tool below to find specific information within the annual report.-
 1
1 -
2
-
3
-
4
-
5
-
6
-
7
-
8
-
9
-
10
-
11
-
12
-
13
-
14
-
15
-
16
-
17
-
18
-
19
-
20
-
 21
21 -
 22
22 -
 23
23 -
 24
24 -
 25
25 -
 26
26 -
 27
27 -
 28
28 -
 29
29 -
 30
30 -
 31
31 -
 32
32 -
 33
33 -
 34
34 -
 35
35 -
 36
36 -
 37
37 -
 38
38 -
 39
39 -
 40
40 -
 41
41 -
42
-
43
-
44
-
45
-
46
-
47
-
48
-
49
-
50
-
51
-
52
-
53
-
54
-
55
-
56
-
57
-
58
-
59
-
60
-
61
-
62
-
63
-
64
-
65
-
66
-
67
-
68
-
69
-
70
-
71
-
72
-
73
-
74
-
75
-
76
-
77
-
78
-
79
-
80
-
81
-
82
-
83
-
84
-
85
-
86
-
87
-
88
-
89
-
90
-
91
-
92
-
93
-
94
-
95
-
96
-
97
-
98
-
99
-
100
 |
 |

24
expected to decline and the percentage of vehicles that are new to five years old is expected to increase. This will slow the
growth of average vehicle age, which increased from 10.3 years in 2009 to 11.4 years in 2013. However, we believe that the
stabilization of average age of vehicles will continue to benefit our industry in the near term and the overall increase in the total
number of vehicles on the road is positive for the longer term as these vehicles age outside of their manufacturer warranty
period and require more expensive maintenance and repairs due to the increase in complexity of automobile parts.
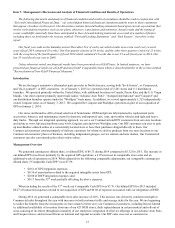
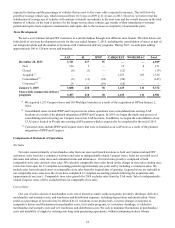
Store Development
We serve our Commercial and DIY customers in a similar fashion through four different store brands. The table below sets
forth detail of our store development activity for the year ended January 3, 2015, including the consolidation of stores as part of
our integration plans and the number of locations with Commercial delivery programs. During 2015, we anticipate adding
approximately 100 to 120 new stores and branches.
AAP AI BWP CARQUEST WORLDPAC Total
December 28, 2013 3,741 217 91 — — 4,049
New 126 5 — 12 8 151
Closed (6) (1) — (12)—
(19)
Acquired (1) — — — 1,233 103 1,336
Consolidated (2) (2) (11) (34)(98)—
(145)
Converted (3) 29 — (19)(10)——
January 3, 2015 3,888 210 38 1,125 111 5,372
Stores with commercial delivery
programs 3,497 210 38 1,125 111 4,981
(1) We acquired 1,233 Carquest stores and 103 Worldpac branches as a result of the acquisition of GPI on January 2,
2014.
(2) Consolidated stores include BWP and Carquest stores whose operations were consolidated into existing AAP
locations as a result of the planned integration of BWP and Carquest. In 2014, we began the multi-year process of
consolidating and converting our Carquest stores into AAP locations. In addition, we began the consolidation of our
33 AI stores located in Florida into existing AAP locations which is expected to be completed by the end of 2015.
(3) Converted stores include BWP and Carquest stores that were re-branded as an AAP store as a result of the planned
integration of BWP and Carquest.
Components of Statement of Operations
Net Sales
Net sales consist primarily of merchandise sales from our store and branch locations to both our Commercial and DIY
customers, sales from our e-commerce websites and sales to independently-owned Carquest stores. Sales are recorded net of
discounts and rebates, sales taxes and estimated returns and allowances. Our total sales growth is comprised of both
comparable store sales and new store sales. We calculate comparable store sales based on the change in store sales starting once
a store has been open for 13 complete accounting periods (approximately one year) and by including e-commerce sales. We
include sales from relocated stores in comparable store sales from the original date of opening. Acquired stores are included in
our comparable store sales once the stores have completed 13 complete accounting periods following the acquisition date
(approximately one year). Comparable store sales growth for 2014 excludes sales from the 53rd week. Sales to independently-
owned Carquest stores will be excluded from our comparable store sales.
Cost of Sales
Our cost of sales consists of merchandise costs, net of incentives under vendor programs; inventory shrinkage, defective
merchandise and warranty costs; and warehouse and distribution expenses, including depreciation and amortization. Gross
profit as a percentage of net sales may be affected by (i) variations in our product mix, (ii) price changes in response to
competitive factors and fluctuations in merchandise costs, (iii) vendor programs, (iv) inventory shrinkage, (v) defective
merchandise and warranty costs and (vi) warehouse and distribution costs. We seek to minimize fluctuations in merchandise
costs and instability of supply by entering into long-term purchasing agreements, without minimum purchase volume