Acer 2007 Annual Report Download - page 81
Download and view the complete annual report
Please find page 81 of the 2007 Acer annual report below. You can navigate through the pages in the report by either clicking on the pages listed below, or by using the keyword search tool below to find specific information within the annual report.-
 1
1 -
2
-
3
-
4
-
5
-
6
-
7
-
8
-
9
-
10
-
11
-
12
-
13
-
14
-
15
-
16
-
17
-
18
-
19
-
20
-
21
-
22
-
23
-
24
-
25
-
26
-
27
-
28
-
29
-
30
-
31
-
32
-
33
-
34
-
35
-
36
-
37
-
38
-
39
-
40
-
41
-
42
-
43
-
44
-
45
-
46
-
47
-
48
-
49
-
50
-
51
-
52
-
53
-
54
-
55
-
56
-
57
-
58
-
59
-
60
-
61
-
62
-
63
-
64
-
65
-
66
-
67
-
68
-
69
-
70
-
 71
71 -
 72
72 -
 73
73 -
 74
74 -
 75
75 -
 76
76 -
 77
77 -
 78
78 -
 79
79 -
 80
80 -
 81
81 -
 82
82 -
 83
83 -
 84
84 -
 85
85 -
 86
86 -
 87
87 -
 88
88 -
 89
89 -
 90
90 -
 91
91 -
92
-
93
-
94
-
95
-
96
-
97
-
98
-
99
-
100
-
101
-
102
-
103
-
104
-
105
-
106
-
107
-
108
-
109
-
110
-
111
-
112
-
113
-
114
-
115
-
116
-
117
 |
 |

78
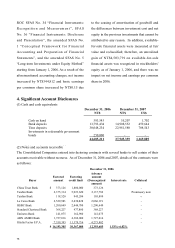
ROC SFAS No. 34 “Financial Instruments:
Recognition an d Measurement ”, SFAS
No. 36 “Financial Instruments: Disclosure
and Presentation”, the amended SFAS No.
1 “Conceptual Framework for Financial
Accounting and Preparation of Financial
Statements”, and the amended SFAS No. 5
“Long-term Investments under Equity Method”
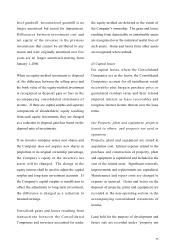
starting from January 1, 2006. As a result of the
aforementioned accounting changes, net income
increased by NT$344,812 and basic earnings
per common share increased by NT$0.15 due
to the ceasing of amortization of goodwill and
the differences between investment cost and net
equity in the previous investments that cannot be
attributed to any reason. In addition, available-
for-sale financial assets were measured at fair
value and reclassified; therefore, an unrealized
gain of NT$4,503,791 on available-for-sale
nancial assets was recognized in stockholders’
equity as of January 1, 2006, and there was no
impact on net income and earnings per common
share in 2006.
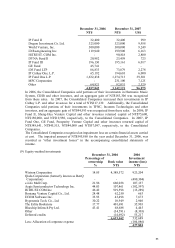
4. Signicant Account Disclosures
(1) Cash and cash equivalents
(1) Cash and cash equivalents
December 31, 2006 December 31, 2007
NT$ NT$ US$
Cash on hand 593,543 55,207 1,702
Bank deposits 13,793,434 14,908,552 459,644
Time deposits 30,048,234 22,981,580 708,543
Investments in redeemable government
bonds 250,000 - -
44,685,211 37,945,339 1,169,889
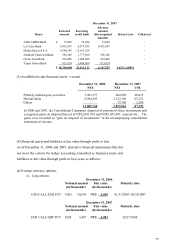
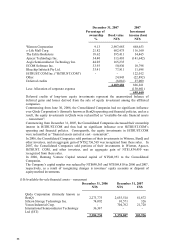
(2) Notes and accounts receivable
ϣ
(2) Notes and accounts receivable
The Consolidated Companies entered into factoring contracts with several banks to sell certain of their
accounts receivable without recourse. As of December 31, 2006 and 2007, details of the contracts were
as follows:
the contracts were as follows:
December 31, 2006
Buyer
Factored
amount
Factoring
credit limit
Advance
amount
(Derecognized
amount)
Interest rate Collateral
China Trust Bank $ 373,126 1,800,000 373,126 -
Taishin Bank 2,375,314 5,923,620 2,137,782 Promissory note
Taishin Bank 118,520 945,284 105,889 ϣ
La Caixa Bank 2,529,983 2,430,828 2,066,119 -
HSBC Bank 1,200,649 2,444,700 1,200,649 -
Standard Chartered Bank 368,227 977,880 368,227 -
Emirates Bank 141,075 162,980 141,075 -
ABN AMRO Bank 1,727,016 4,302,000 1,727,016 -
Ifitalia Factor S.P.A. 7,359,395 11,379,716 4,273,802 -
$ 16,193,305 30,367,008 12,393,685 1.53%~6.02%