Acer 2007 Annual Report Download - page 56
Download and view the complete annual report
Please find page 56 of the 2007 Acer annual report below. You can navigate through the pages in the report by either clicking on the pages listed below, or by using the keyword search tool below to find specific information within the annual report.-
 1
1 -
2
-
3
-
4
-
5
-
6
-
7
-
8
-
9
-
10
-
11
-
12
-
13
-
14
-
15
-
16
-
17
-
18
-
19
-
20
-
21
-
22
-
23
-
24
-
25
-
26
-
27
-
28
-
29
-
30
-
31
-
32
-
33
-
34
-
35
-
36
-
37
-
38
-
39
-
40
-
41
-
42
-
43
-
44
-
45
-
 46
46 -
 47
47 -
 48
48 -
 49
49 -
 50
50 -
 51
51 -
 52
52 -
 53
53 -
 54
54 -
 55
55 -
 56
56 -
 57
57 -
 58
58 -
 59
59 -
 60
60 -
 61
61 -
 62
62 -
 63
63 -
 64
64 -
 65
65 -
 66
66 -
67
-
68
-
69
-
70
-
71
-
72
-
73
-
74
-
75
-
76
-
77
-
78
-
79
-
80
-
81
-
82
-
83
-
84
-
85
-
86
-
87
-
88
-
89
-
90
-
91
-
92
-
93
-
94
-
95
-
96
-
97
-
98
-
99
-
100
-
101
-
102
-
103
-
104
-
105
-
106
-
107
-
108
-
109
-
110
-
111
-
112
-
113
-
114
-
115
-
116
-
117
 |
 |
53
ʳ
ʘ
ʘ
ʘ
ʘ
ʘ
N
ʘ
Ȑ ȑ
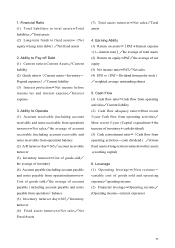
1. Financial Ratio
(1) Total liabilities to total assets=Total
liabilities /Total assets
(2) Long-term funds to fixed assets=(Net
equity+Long term debts)/Net xed assets
2. Ability to Pay off Debt
(1) Current ratio=Current Assets/Current
liability
(2) Quick ratio=(Current assets-Inventory-
Prepaid expenses)/Current liability
(3) Interest protection=Net income before
income tax and interest expense/Interest
expense
3. Ability to Operate
(1) Account receivable (including account
receivable and notes receivable from operation)
turnover=Net sales/the average of account
receivable (including account receivable and
notes receivable from operation) balance
(2) A/R turnover day=365/account receivable
turnover
(3) Inventory turnover=Cost of goods sold/
the average of inventory
(4) Account payable (including account payable
and notes payable from operation)turnover=
Cost of goods sold/the average of account
payable(including account payable and notes
payable from operation)balance
(5) Inventory turnover day=365/Inventory
turnover
(6) Fixed assets turnover=Net sales/Net
Fixed Assets
(7) Total assets turnover=Net sales/Total
assets
4. Earning Ability
(1) Return on assets=〔PAT+Interest expense
×(1-interest rate)〕/the average of total assets
(2) Return on equity=PAT/the average of net
equity
(3) Net income ratio=PAT/Net sales
(4) EPS =(PAT-Dividend from prefer stock)
/weighted average outstanding shares
5. Cash Flow
(1) Cash ow ratio=Cash ow from operating
activities/Current liability
(2) Cash flow adequacy ratio=Most recent
5-year Cash flow from operating activities/
Most recent 5-year (Capital expenditure+the
increase of inventory+cash dividend)
(3) Cash reinvestment ratio=(Cash ow from
operating activities-cash dividend) /(Gross
xed assets+long-term investment+other assets
+working capital)
6. Leverage
(1) Operating leverage=(Nest revenue-
variable cost of goods sold and operating
expense)/operating income
(2) Financial leverage=Operating income/
(Operating income-interest expenses)