Acer 2007 Annual Report Download - page 55
Download and view the complete annual report
Please find page 55 of the 2007 Acer annual report below. You can navigate through the pages in the report by either clicking on the pages listed below, or by using the keyword search tool below to find specific information within the annual report.-
 1
1 -
2
-
3
-
4
-
5
-
6
-
7
-
8
-
9
-
10
-
11
-
12
-
13
-
14
-
15
-
16
-
17
-
18
-
19
-
20
-
21
-
22
-
23
-
24
-
25
-
26
-
27
-
28
-
29
-
30
-
31
-
32
-
33
-
34
-
35
-
36
-
37
-
38
-
39
-
40
-
41
-
42
-
43
-
44
-
 45
45 -
 46
46 -
 47
47 -
 48
48 -
 49
49 -
 50
50 -
 51
51 -
 52
52 -
 53
53 -
 54
54 -
 55
55 -
 56
56 -
 57
57 -
 58
58 -
 59
59 -
 60
60 -
 61
61 -
 62
62 -
 63
63 -
 64
64 -
 65
65 -
66
-
67
-
68
-
69
-
70
-
71
-
72
-
73
-
74
-
75
-
76
-
77
-
78
-
79
-
80
-
81
-
82
-
83
-
84
-
85
-
86
-
87
-
88
-
89
-
90
-
91
-
92
-
93
-
94
-
95
-
96
-
97
-
98
-
99
-
100
-
101
-
102
-
103
-
104
-
105
-
106
-
107
-
108
-
109
-
110
-
111
-
112
-
113
-
114
-
115
-
116
-
117
 |
 |
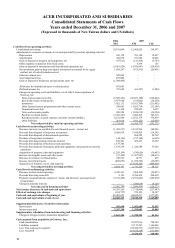
52
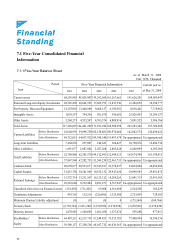
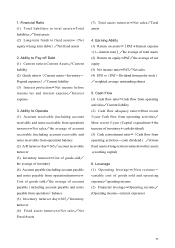
7.2 Five-Year Financial Analysis
Five-Year Financial Information
Period
Itemʳ
2003 NT$ 2004 NT$ 2005 NT$ 2006 NT$ 2007 NT$
Current year
as of Mar.
31, 2008
Financial Total Liabilities to Total
Assets 45.00 50.01 60.81 59.92 68.18 67.85
Ratio (%) Long-term Debts to Fixed
Assets 522.03 480.13 733.23 1,268.55 1,162.99 1,231.92
Current Ratio (ʘ)156.62 141.96 136.30 146.65 134.15 132.00
Quick Ratio (ʘ)130.72 117.11 106.20 121.20 106.32 103.29
Ability to
Payoff Debt
Interest Protection 15 15 29 33 21 12
A/R Turnover (times) 6.58 7.28 6.05 5.26 5.34 4.97
A/R Turnover Days 55 50 60 69 68 73
Inventory Turnover (times) 16.82 17.52 13.39 12.01 13.88 12.78
Inventory Turnover Days 22 21 27 30 26 29
A/P Turnover (times) 6.77 7.80 5.67 4.72 5.63 5.64
Fixed Assets Turnover
(times) 11.18 16.73 33.60 56.67 53.50 66.01
Ability to
Operation
Total Assets Turnover
(times) 1.34 1.81 1.85 1.86 1.90 2.14
Return on Assets (ʘ)6.85 6.17 5.92 5.85 6.27 5.29
Return on Equity (ʘ)11.06 11.07 13.10 14.31 16.94 15.35
Operating
Income 8.91 18.18 33.93 31.93 42.34 45.53
To Pay-in
Capital ʘ
PBT 40.73 41.28 47.25 57.97 62.81 54.92
N
et Income Ratio (ʘ)4.64 3.12 2.67 2.91 2.80 2.32
Earning
Ability
Earning Per ShareȐNT$ȑ2.93 2.94 3.58 4.32 5.48 1.25
Cash Flow Ratio 16.54 3.40 6.97 12.03 (4.59) (0.55)
Cash Flow Adequacy Ratio 15.69 19.96 46.41 61.02 26.47 18.54
Cash Flow
(%)
Cash Reinvestment Ratio 4.63 (4.24) 3.11 7.89 (19.89) (1.04)
Operating Leverage 8.00 4.90 2.93 3.45 2.99 3.10
Leverage
Financial Leverage 1.5 1.19 1.05 1.06 1.08 1.12