Acer 2007 Annual Report Download - page 112
Download and view the complete annual report
Please find page 112 of the 2007 Acer annual report below. You can navigate through the pages in the report by either clicking on the pages listed below, or by using the keyword search tool below to find specific information within the annual report.-
 1
1 -
2
-
3
-
4
-
5
-
6
-
7
-
8
-
9
-
10
-
11
-
12
-
13
-
14
-
15
-
16
-
17
-
18
-
19
-
20
-
21
-
22
-
23
-
24
-
25
-
26
-
27
-
28
-
29
-
30
-
31
-
32
-
33
-
34
-
35
-
36
-
37
-
38
-
39
-
40
-
41
-
42
-
43
-
44
-
45
-
46
-
47
-
48
-
49
-
50
-
51
-
52
-
53
-
54
-
55
-
56
-
57
-
58
-
59
-
60
-
61
-
62
-
63
-
64
-
65
-
66
-
67
-
68
-
69
-
70
-
71
-
72
-
73
-
74
-
75
-
76
-
77
-
78
-
79
-
80
-
81
-
82
-
83
-
84
-
85
-
86
-
87
-
88
-
89
-
90
-
91
-
92
-
93
-
94
-
95
-
96
-
97
-
98
-
99
-
100
-
101
-
 102
102 -
 103
103 -
 104
104 -
 105
105 -
 106
106 -
 107
107 -
 108
108 -
 109
109 -
 110
110 -
 111
111 -
 112
112 -
 113
113 -
 114
114 -
 115
115 -
 116
116 -
 117
117
 |
 |

109
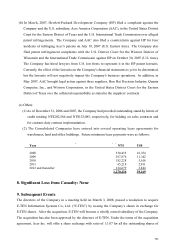
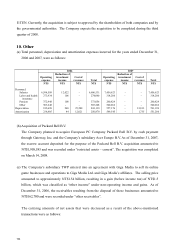
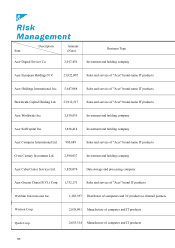
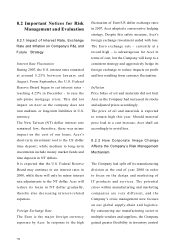
8.1 Annual Investment Policy:
Reasons of Gain or Loss and Improvement Plan
!!!!!!!!!!!!!!!
! ! !Year 2007 P&L!Main Reason of Gain or Loss!The Plan for
Improvement
Investment
Plan for Next
Year
673,975 Recognized disposal gain for land !
6,230,682 Stable growth in Europe !
1,245,183 Stable growth in Asia Pacific !
577,781 Stable growth in Pan America
ʳ ʳ
134,500 Recognized dividend income !
130,386 Recognized dividend income Not Not!
-1,774 Operating expenses applicable
.
applicable.
244,439 Recognized disposal stock gain !
8,402 Gain on operating activity !
162,493 Great China market gain !
82,417 Gain on operating activity !
637,398 Gain on operating activity !
!