Acer 2007 Annual Report Download - page 30
Download and view the complete annual report
Please find page 30 of the 2007 Acer annual report below. You can navigate through the pages in the report by either clicking on the pages listed below, or by using the keyword search tool below to find specific information within the annual report.-
 1
1 -
2
-
3
-
4
-
5
-
6
-
7
-
8
-
9
-
10
-
11
-
12
-
13
-
14
-
15
-
16
-
17
-
18
-
19
-
 20
20 -
 21
21 -
 22
22 -
 23
23 -
 24
24 -
 25
25 -
 26
26 -
 27
27 -
 28
28 -
 29
29 -
 30
30 -
 31
31 -
 32
32 -
 33
33 -
 34
34 -
 35
35 -
 36
36 -
 37
37 -
 38
38 -
 39
39 -
 40
40 -
41
-
42
-
43
-
44
-
45
-
46
-
47
-
48
-
49
-
50
-
51
-
52
-
53
-
54
-
55
-
56
-
57
-
58
-
59
-
60
-
61
-
62
-
63
-
64
-
65
-
66
-
67
-
68
-
69
-
70
-
71
-
72
-
73
-
74
-
75
-
76
-
77
-
78
-
79
-
80
-
81
-
82
-
83
-
84
-
85
-
86
-
87
-
88
-
89
-
90
-
91
-
92
-
93
-
94
-
95
-
96
-
97
-
98
-
99
-
100
-
101
-
102
-
103
-
104
-
105
-
106
-
107
-
108
-
109
-
110
-
111
-
112
-
113
-
114
-
115
-
116
-
117
 |
 |
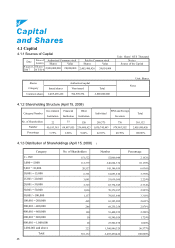
27
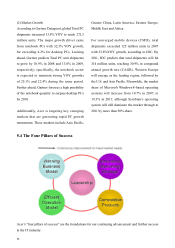
Shares
Name Number Percentage
JPMorgan Chase Bank N.A. Taipei Branch in Custody
for Capital World Growth and Income Fund Inc. 118,605,500 4.93%
JPMorgan Chase Bank N.A. Taipei Branch in Custody
for EuroPacific Growth Fund 114,007,101 4.74%
Stan Shih 72,927,824 3.03%
Hong Rong Investment Corp. 66,069,816 2.75%
Management Board of Public Service Pension Fund 50,182,240 2.09%
Sansar Capital Master Fund, L.P. 40,622,000 1.69%
Acer Inc. Global Depositary Receipt 39,471,755 1.64%
Bureau of Labor Insurance 33,166,844 1.38%
Eleven Trustees in Total as Trustee for The New
Economy Fund 28,216,654 1.17%
JPMorgan Chase Bank N.A. Taipei Branch in Custody
for Capital Income Builder, Inc. 23,804,795 0.99%
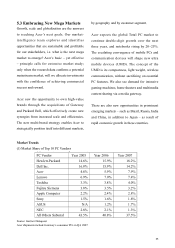
4.1.5 Market Price Per Share, Net Value, Earning& Dividend For Latest Two Years
Period
Item
2006 2007 Until Mar. 31st,
2008
Highest 82.03 78.10 61.5
Lowest 40.09 55.10 48.1
Market Price Per
Share
Average 58.87 64.10 53.80
Before Distribution 32.24 32.49 31.90
Net Value Per
Share After Distribution 28.09 Un-appropriated Un-appropriated
2,364,132 2,364,132 2,364,132
Weighted Average Share Numbers Thousand shares Thousand shares Thousand shares
Current 4.45 5.48 1.25
Earning Per Share
Earning Per Share Adjusted 4.32 Un-appropriated Un-appropriated
Cash Dividend (NT$) 3.85 3.6
Retained Earning (%) 0.15 0.15
Stock
Dividend Capital Surplus (%) - -
Un-appropriated
Dividend Per
Share
Accumulated unpaid dividends - - -
P/E Ratio 13.23 11.70 -
P/D Ratio 15.29 17.81 -
Return on
Investment
Analysis Cash Dividend Yield 6.54% 5.62% -
4.1.4 List of Major Shareholders
4.1.5 Market Price Per Share, Net Value, Earning& Dividend For Latest Two Years