Acer 2007 Annual Report Download - page 65
Download and view the complete annual report
Please find page 65 of the 2007 Acer annual report below. You can navigate through the pages in the report by either clicking on the pages listed below, or by using the keyword search tool below to find specific information within the annual report.-
 1
1 -
2
-
3
-
4
-
5
-
6
-
7
-
8
-
9
-
10
-
11
-
12
-
13
-
14
-
15
-
16
-
17
-
18
-
19
-
20
-
21
-
22
-
23
-
24
-
25
-
26
-
27
-
28
-
29
-
30
-
31
-
32
-
33
-
34
-
35
-
36
-
37
-
38
-
39
-
40
-
41
-
42
-
43
-
44
-
45
-
46
-
47
-
48
-
49
-
50
-
51
-
52
-
53
-
54
-
 55
55 -
 56
56 -
 57
57 -
 58
58 -
 59
59 -
 60
60 -
 61
61 -
 62
62 -
 63
63 -
 64
64 -
 65
65 -
 66
66 -
 67
67 -
 68
68 -
 69
69 -
 70
70 -
 71
71 -
 72
72 -
 73
73 -
 74
74 -
 75
75 -
76
-
77
-
78
-
79
-
80
-
81
-
82
-
83
-
84
-
85
-
86
-
87
-
88
-
89
-
90
-
91
-
92
-
93
-
94
-
95
-
96
-
97
-
98
-
99
-
100
-
101
-
102
-
103
-
104
-
105
-
106
-
107
-
108
-
109
-
110
-
111
-
112
-
113
-
114
-
115
-
116
-
117
 |
 |

62
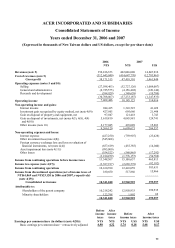
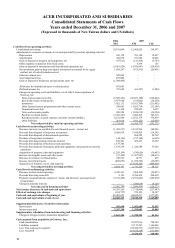
ACER INCORPORATED AND SUBSIDIARIES
Consolidated Statements of Cash Flows
Years ended December 31, 2006 and 2007
(Expressed in thousands of New Taiwan dollars and US dollars)
2006 2007
NT$ NT$ US$
Cash flows from operating activities:
Consolidated net income 10,341,040 12,960,925 399,597
Adjustments to reconcile net income to net cash provided by (used in) operating activities:
Depreciation 841,138 591,189 18,227
Amortization 250,870 551,280 16,996
Gain on disposal of property and equipment, net (97,011) (121,418) (3,743)
Other expenses reclassified from fixed assets - 4,369 135
Gain on disposal of investments and discontinued operations, net (5,619,929) (4,476,991) (138,030)
Net investment gain on long-term equity investments accounted for by equity
method, net of cash dividends received
1,564,267 (875,415) (26,991)
Other investment loss 545,868 - -
Asset impairment loss 995,000 - -
Gain on disposal of businesses and operations (note 10) (1,504,945) - -
Allowance for doubtful advances to related parties 385,043 - -
Deferred income tax 733,685 (61,297) (1,890)
Changes in operating assets and liabilities, net of effects from acquisition of
Gateway, Inc.:
Notes and accounts receivable (5,845,423) (20,253,180) (624,424)
Receivables from related parties 5,077,680 (335,002) (10,328)
Inventories 3,421,113 (6,921,700) (213,402)
Other financial assets, prepayments and other current assets 258,683 (1,055,734) (32,549)
Noncurrent receivable 6,454 224,925 6,935
Notes and accounts payable 820,928 (1,826,219) (56,304)
Payables to related parties (7,281,227) 3,409,436 105,116
Royalties payable, accrued expenses and other current liabilities 8,122,849 12,015,179 370,439
Other liabilities 218,810 (391,122) (12,059)
Net cash provided by (used in) operating activities 13,234,893 (6,560,775) (202,275)
Cash flows from investing activities:
Decrease (increase) in available-for-sale financial assetsЁcurrent, net (1,439,537) 12,332,596 380,226
Proceeds from disposal of long-term investments 6,028,639 7,018,429 216,385
Proceeds from disposal of discontinued operations - 868,222 26,768
Purchase of long-term investments (44,366) (217,140) (6,695)
Proceeds from long-term investments returned 294,501 495,253 15,269
Proceeds from disposal of businesses and operations 1,379,364 - -
Proceeds from disposal of property, plant and equipment, and property not used in
operations
1,339,539 1,220,389 37,626
Acquisition of property, plant and equipment (1,205,199) (534,626) (16,483)
Increase in intangible assets and other assets (57,429) (1,427,547) (44,013)
Decrease in advances to related parties 249,522 14,771 455
Increase in restricted assets (480,837) (1,958,585) (60,385)
Acquisition of business, net of cash acquired - (15,070,542) (464,638)
Net cash provided by investing activities 6,064,197 2,741,220 84,515
Cash flows from financing activities:
Decrease in short-term borrowings 4,228,561 (968,414) (29,857)
Proceeds from long-term debt 8,143 6,760,438 208,430
Payment of cash dividends, employees’ bonus, and directors’ and supervisors’
remuneration
(7,138,499) (9,395,445) (289,670)
Change in minority interests - (296,018) (9,126)
Net cash used in financing activities (2,901,795) (3,899,439) (120,223)
Net increase (decrease) in cash and cash equivalents 16,397,295 (7,718,994) (237,983)
Effects of exchange rate changes (194,737) 979,122 30,187
Cash and cash equivalents at beginning of year 28,482,653 44,685,211 1,377,685
Cash and cash equivalents at end of year 44,685,211 37,945,339 1,169,889
Supplemental disclosures of cash flow information
Interest paid 545,690 1,052,609 32,453
Income taxes paid 2,247,298 1,395,005 43,009
Supplementary schedules of non-cash investing and financing activities:
Change in foreign currency translation adjustment 1,562,306 1,398,399 43,114
Cash acquired from acquisition of Gateway, Inc.:
Cash consideration 23,507,016 724,742
Liabilities assumed 37,173,295 1,146,086
Less: Non-cash assets acquired (35,589,573) (1,097,258)
Less: Goodwill (16,654,264) (513,466)
8,436,474 260,104