Acer 2007 Annual Report Download - page 54
Download and view the complete annual report
Please find page 54 of the 2007 Acer annual report below. You can navigate through the pages in the report by either clicking on the pages listed below, or by using the keyword search tool below to find specific information within the annual report.-
 1
1 -
2
-
3
-
4
-
5
-
6
-
7
-
8
-
9
-
10
-
11
-
12
-
13
-
14
-
15
-
16
-
17
-
18
-
19
-
20
-
21
-
22
-
23
-
24
-
25
-
26
-
27
-
28
-
29
-
30
-
31
-
32
-
33
-
34
-
35
-
36
-
37
-
38
-
39
-
40
-
41
-
42
-
43
-
 44
44 -
 45
45 -
 46
46 -
 47
47 -
 48
48 -
 49
49 -
 50
50 -
 51
51 -
 52
52 -
 53
53 -
 54
54 -
 55
55 -
 56
56 -
 57
57 -
 58
58 -
 59
59 -
 60
60 -
 61
61 -
 62
62 -
 63
63 -
 64
64 -
65
-
66
-
67
-
68
-
69
-
70
-
71
-
72
-
73
-
74
-
75
-
76
-
77
-
78
-
79
-
80
-
81
-
82
-
83
-
84
-
85
-
86
-
87
-
88
-
89
-
90
-
91
-
92
-
93
-
94
-
95
-
96
-
97
-
98
-
99
-
100
-
101
-
102
-
103
-
104
-
105
-
106
-
107
-
108
-
109
-
110
-
111
-
112
-
113
-
114
-
115
-
116
-
117
 |
 |
51
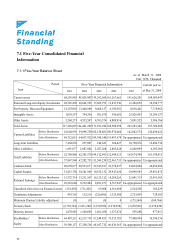
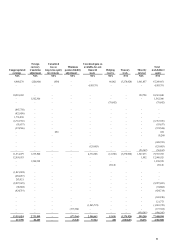
As of March 31, 2008
Unit: NT$ Thousand
Five-Year Financial Information
Period
Item 2003 2004 2005 2006 2007
Current year
as of Mar 31,
2008
Operating Revenue 157,655,398 225,014,007 318,087,679 350,816,353 462,066,080 127,376,081
Gross Profit 20,811,379 27,219,303 34,121,461 38,171,313 47,418,310 13,464,815
Operating Income 1,840,636 3,806,657 7,648,961 7,462,446 10,185,123 2,738,189
N
on-operating Income and Gain 8,466,976 6,742,733 7,176,374 9,266,120 6,699,671 2,427,041
N
on-operating Expense and Loss 1,897,386 1,908,790 4,172,803 3,180,259 1,776,157 1,862,421
Income Before Income Taxes 8,410,226 8,640,600 10,652,532 13,548,307 15,108,637 3,302,808
Income (Loss) from Discontinued
Segment 0 0 0 180,650 517,866 100,000
Extraordinary Items 0 0 0 0 0 0
Cumulative Effect of Changes in
Accounting Principle 0 0 0 0 0 0
Income After Income Taxes 7,313,809 7,011,661 8,477,502 10,218,242 12,958,933 2,951,789
Earning Per Share 2.93 2.94 3.58 4.32 5.48 1.25
7.1.3 CPAs and Auditor’s Opinions:
Year Name of CPA(s) Auditor’s Opinion
2003 James Wu, Sonia Chang Unqualified
2004 Sonia Chang, Winston Yu Unqualified
2005 Sonia Chang, Winston Yu Unqualified
2006 Winston Yu, Albert Lou Modified unqualified
2007 Sonia Chang, Winston Yu Unqualified
7.1.2 Five-Year Consolidated Income Statement
7.1.3 CPAs and Auditor’s Opinions: