Acer 2007 Annual Report Download - page 109
Download and view the complete annual report
Please find page 109 of the 2007 Acer annual report below. You can navigate through the pages in the report by either clicking on the pages listed below, or by using the keyword search tool below to find specific information within the annual report.-
 1
1 -
2
-
3
-
4
-
5
-
6
-
7
-
8
-
9
-
10
-
11
-
12
-
13
-
14
-
15
-
16
-
17
-
18
-
19
-
20
-
21
-
22
-
23
-
24
-
25
-
26
-
27
-
28
-
29
-
30
-
31
-
32
-
33
-
34
-
35
-
36
-
37
-
38
-
39
-
40
-
41
-
42
-
43
-
44
-
45
-
46
-
47
-
48
-
49
-
50
-
51
-
52
-
53
-
54
-
55
-
56
-
57
-
58
-
59
-
60
-
61
-
62
-
63
-
64
-
65
-
66
-
67
-
68
-
69
-
70
-
71
-
72
-
73
-
74
-
75
-
76
-
77
-
78
-
79
-
80
-
81
-
82
-
83
-
84
-
85
-
86
-
87
-
88
-
89
-
90
-
91
-
92
-
93
-
94
-
95
-
96
-
97
-
98
-
 99
99 -
 100
100 -
 101
101 -
 102
102 -
 103
103 -
 104
104 -
 105
105 -
 106
106 -
 107
107 -
 108
108 -
 109
109 -
 110
110 -
 111
111 -
 112
112 -
 113
113 -
 114
114 -
 115
115 -
 116
116 -
 117
117
 |
 |

106
2007
Taiwan
North
America Europe Asia Eliminations Consolidated
NT$ NT$ NT$ NT$ NT$ NT$
Area income:
Customers 76,661,514 107,143,739 240,492,931 61,752,116 - 486,050,300
Inter-company 264,932,323 4,101 7,242,154 11,096 (272,189,674) -
341,593,837 107,147,840 247,735,085 61,763,212 (272,189,674) 486,050,300
Investment income 87,410
Gain on disposal of
investments
4,120,782
Total income 491,042,492
Area profit (loss) before
income taxes 264,813,577 926,347 15,381,028 2,298,916 (272,292,965)11,126,903
Net investment income 695,660
Gain on disposal of
investments, net
4,045,981
Interest expense (759,907)
Consolidated income
before income taxes 15,168,637
Area identifiable assets 100,327,411 58,022,952 88,086,758 28,618,423 (53,352,602) 221,702,942
Equity method investments 4,689,684
Goodwill 16,890,716
Total assets 243,283,342
Depreciation and
amortization 1,088,239 32,112 11,239 10,879 - 1,142,469
Capital expenditures 665,555 59,128 140,593 185,338 - 1,050,664
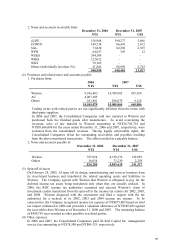
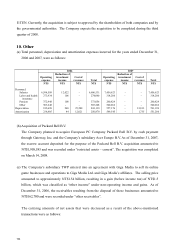
(c) Export sales
Export sales of the Company and its domestic subsidiaries for the years ended December 31,
2006 and 2007, were as follows:
2006 2007
Sales to: NT$ NT$ US$
North America 297,386 1,102,022 33,976
Europe 9,541 - -
Other 2,456,462 970,968 29,936
2,763,389 2,072,990 63,912
(d) Major customers
Sales to individual customers comprising over 10% of the Consolidated Companies’ revenues
are summarized below:
2006 2007
NT$ Percentage NT$ US$ Percentage
Customer A 47,790,111 13% 30,325,050 934,948 7%
2007