Acer 2007 Annual Report Download - page 108
Download and view the complete annual report
Please find page 108 of the 2007 Acer annual report below. You can navigate through the pages in the report by either clicking on the pages listed below, or by using the keyword search tool below to find specific information within the annual report.-
 1
1 -
2
-
3
-
4
-
5
-
6
-
7
-
8
-
9
-
10
-
11
-
12
-
13
-
14
-
15
-
16
-
17
-
18
-
19
-
20
-
21
-
22
-
23
-
24
-
25
-
26
-
27
-
28
-
29
-
30
-
31
-
32
-
33
-
34
-
35
-
36
-
37
-
38
-
39
-
40
-
41
-
42
-
43
-
44
-
45
-
46
-
47
-
48
-
49
-
50
-
51
-
52
-
53
-
54
-
55
-
56
-
57
-
58
-
59
-
60
-
61
-
62
-
63
-
64
-
65
-
66
-
67
-
68
-
69
-
70
-
71
-
72
-
73
-
74
-
75
-
76
-
77
-
78
-
79
-
80
-
81
-
82
-
83
-
84
-
85
-
86
-
87
-
88
-
89
-
90
-
91
-
92
-
93
-
94
-
95
-
96
-
97
-
 98
98 -
 99
99 -
 100
100 -
 101
101 -
 102
102 -
 103
103 -
 104
104 -
 105
105 -
 106
106 -
 107
107 -
 108
108 -
 109
109 -
 110
110 -
 111
111 -
 112
112 -
 113
113 -
 114
114 -
 115
115 -
 116
116 -
 117
117
 |
 |

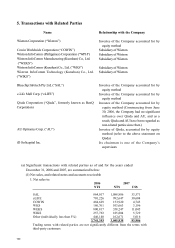
105
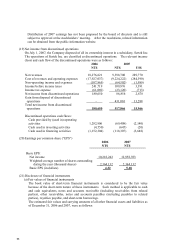
transactions were as follows:
NT$
Accounts receivable 85,562
Accounts receivable from related parties 21,767
Other current assets 4,271
Property, plant and equipment 11,818
Other assets 2,935
Accounts payable (818)
Accrued expenses and other current liabilities (88,417)
37,118
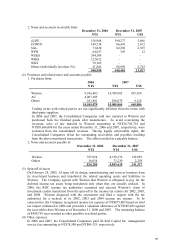
2006
Taiwan
North
America Europe Asia Eliminations Consolidated
NT$ NT$ NT$ NT$ NT$ NT$
Area income:
Customers 77,991,430 57,488,711 184,892,473 63,887,884 - 384,260,498
Inter-company 214,021,404 240,730 4,973,158 106,486 (219,341,778) -
292,012,834 57,729,441 189,865,631 63,994,370 (219,341,778) 384,260,498
Investment income 1,049,743
Gain on disposal of
investments
5,660,889
Total income 390,971,130
Area profit (loss) before
income taxes 1,765,124 73,789 4,863,002 1,588,700 (1,130) 8,289,485
Net investment income 427,803
Gain on disposal of
investments, net
5,619,929
Interest expense (547,191)
Consolidated income
before income taxes 13,790,026
Area identifiable assets 109,840,228 15,352,531 85,595,843 22,695,598 (51,841,692) 181,642,508
Equity method investments 6,613,462
Goodwill 244,328
Total assets 188,500,298
Depreciation and
amortization 1,077,609 - 9,089 5,310 - 1,092,008
Capital expenditures 823,146 34,826 203,169 144,058 - 1,205,199
11. Segment Information
(a) Industry segment
The main business of the Consolidated Companies is to sell “Acer” brand-name desktop PCs,
notebook PCs, and other related IT products, which represents a single industry.
(b) Geographic information
Information by geographic area as of and the years ended December 31, 2006 and 2007, was as
follows:
2006