Acer 2007 Annual Report Download - page 60
Download and view the complete annual report
Please find page 60 of the 2007 Acer annual report below. You can navigate through the pages in the report by either clicking on the pages listed below, or by using the keyword search tool below to find specific information within the annual report.-
 1
1 -
2
-
3
-
4
-
5
-
6
-
7
-
8
-
9
-
10
-
11
-
12
-
13
-
14
-
15
-
16
-
17
-
18
-
19
-
20
-
21
-
22
-
23
-
24
-
25
-
26
-
27
-
28
-
29
-
30
-
31
-
32
-
33
-
34
-
35
-
36
-
37
-
38
-
39
-
40
-
41
-
42
-
43
-
44
-
45
-
46
-
47
-
48
-
49
-
 50
50 -
 51
51 -
 52
52 -
 53
53 -
 54
54 -
 55
55 -
 56
56 -
 57
57 -
 58
58 -
 59
59 -
 60
60 -
 61
61 -
 62
62 -
 63
63 -
 64
64 -
 65
65 -
 66
66 -
 67
67 -
 68
68 -
 69
69 -
 70
70 -
71
-
72
-
73
-
74
-
75
-
76
-
77
-
78
-
79
-
80
-
81
-
82
-
83
-
84
-
85
-
86
-
87
-
88
-
89
-
90
-
91
-
92
-
93
-
94
-
95
-
96
-
97
-
98
-
99
-
100
-
101
-
102
-
103
-
104
-
105
-
106
-
107
-
108
-
109
-
110
-
111
-
112
-
113
-
114
-
115
-
116
-
117
 |
 |
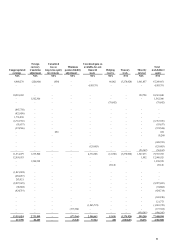
57
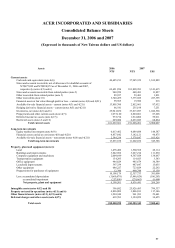
Assets 2006 2007
NT$ NT$ US$
Current assets:
Cash and cash equivalents (note 4(l)) 44,685,211 37,945,339 1,169,889
Notes and accounts receivable, net of allowance for doubtful accounts of
NT$677,092 and NT$898,972 as of December 31, 2006 and 2007,
respectively (notes 4(2) and 6) 69,621,856 101,898,281 3,141,615
Notes and accounts receivable from related parties (note 5) 940,950 448,481 13,827
Other receivable from related parties (note 5) 89,937 59,403 1,831
Other receivables (note 10) 3,740,455 7,375,569 227,395
Financial assets at fair value through profit or lossЁcurrent (notes 4(4) and 4(21)) 99,965 19,982 616
Available-for-sale financial assetsЁcurrent (notes 4(3) and 4(21)) 13,805,760 2,852,061 87,932
Hedging derivative financial assetsЁcurrent (notes 4(5) and 4(21)) 66,541 235,198 7,251
Inventories, net (notes 4(6) and 6) 25,941,852 33,815,697 1,042,568
Prepayments and other current assets (note 4(7)) 1,073,120 2,828,601 87,208
Deferred income tax assets (note 4(17)) 972,714 1,914,006 59,011
Restricted assets (notes 6 and 10) 229,300 2,233,583 68,864
Total current assets 161,267,661 191,626,201 5,908,007
Long-term investments
Equity method investments (note 4(9)) 6,613,462 4,689,684 144,587
Financial assets carried at cost (notes 4(8) and 4(21)) 4,837,842 3,142,121 96,875
Available-for-sale financial assetsЁnoncurrent (notes 4(10) and 4(21)) 2,384,234 3,370,847 103,926
Total long-term investments 13,835,538 11,202,652 345,388
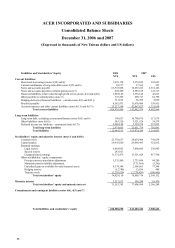
Property, plant and equipment (note 6):
Land 1,478,486 1,560,568 48,114
Buildings and improvements 3,842,966 3,627,214 111,830
Computer equipment and machinery 2,609,649 4,367,924 134,667
Transportation equipment 134,293 114,923 3,543
Office equipment 946,829 985,679 30,389
Leasehold improvements 397,339 487,647 15,035
Other equipment 686,227 723,029 22,292
Prepayments for purchases of equipment 12,390 490,749 15,130
10,108,179 12,357,733 381,000
Less: accumulated depreciation (3,660,678) (3,446,629) (106,263)
accumulated impairment (257,000) (274,663) (8,468)
Net property, plant and equipment 6,190,501 8,636,441 266,269
Intangible assets (notes 4(12) and 10) 396,682 25,926,493 799,337
Property not used in operations (notes 4(11) and 6) 4,896,809 3,806,103 117,346
Other financial assets (notes 4(13), 4(21) and 6) 1,294,344 961,393 29,641
Deferred charges and other assets (note 4(17)) 618,763 1,124,059 34,655
Total assets 188,500,298 243,283,342 7,500,643
Ё
Ё
ACER INCORPORATED AND SUBSIDIARIES
Consolidated Balance Sheets
December 31, 2006 and 2007
(Expressed in thousands of New Taiwan dollars and US dollars)