Acer 2007 Annual Report Download - page 53
Download and view the complete annual report
Please find page 53 of the 2007 Acer annual report below. You can navigate through the pages in the report by either clicking on the pages listed below, or by using the keyword search tool below to find specific information within the annual report.-
 1
1 -
2
-
3
-
4
-
5
-
6
-
7
-
8
-
9
-
10
-
11
-
12
-
13
-
14
-
15
-
16
-
17
-
18
-
19
-
20
-
21
-
22
-
23
-
24
-
25
-
26
-
27
-
28
-
29
-
30
-
31
-
32
-
33
-
34
-
35
-
36
-
37
-
38
-
39
-
40
-
41
-
42
-
 43
43 -
 44
44 -
 45
45 -
 46
46 -
 47
47 -
 48
48 -
 49
49 -
 50
50 -
 51
51 -
 52
52 -
 53
53 -
 54
54 -
 55
55 -
 56
56 -
 57
57 -
 58
58 -
 59
59 -
 60
60 -
 61
61 -
 62
62 -
 63
63 -
64
-
65
-
66
-
67
-
68
-
69
-
70
-
71
-
72
-
73
-
74
-
75
-
76
-
77
-
78
-
79
-
80
-
81
-
82
-
83
-
84
-
85
-
86
-
87
-
88
-
89
-
90
-
91
-
92
-
93
-
94
-
95
-
96
-
97
-
98
-
99
-
100
-
101
-
102
-
103
-
104
-
105
-
106
-
107
-
108
-
109
-
110
-
111
-
112
-
113
-
114
-
115
-
116
-
117
 |
 |
50
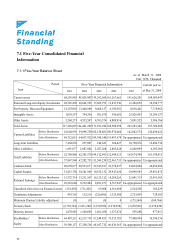
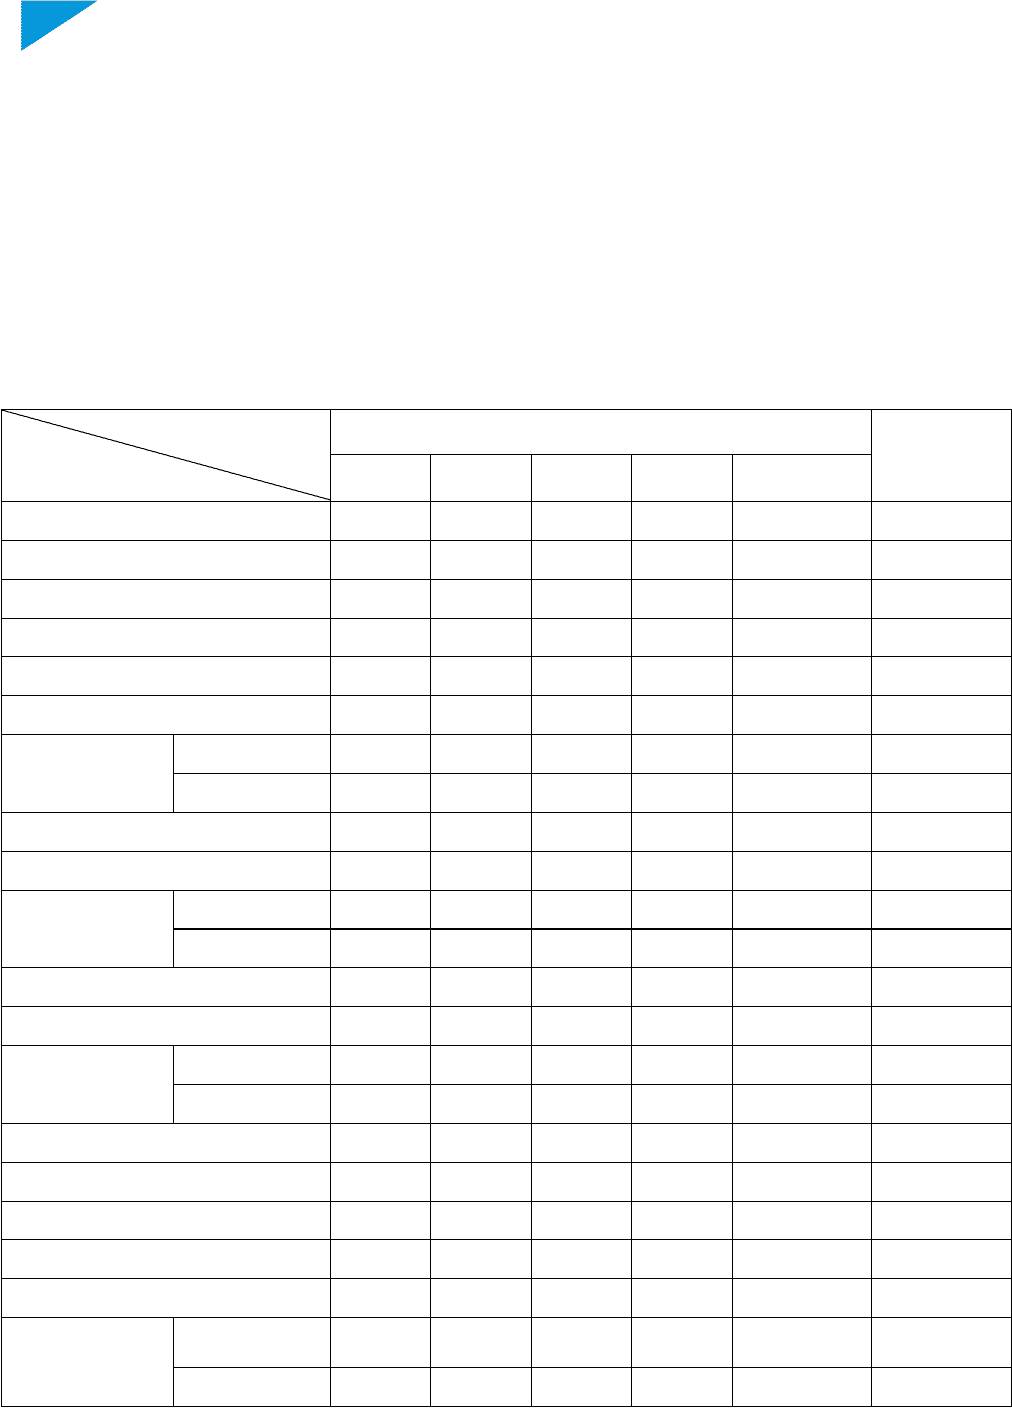
7.1 Five-Year Consolidated Financial
Information
7.1.1 Five-Year Balance Sheet
7
Financial
Standing
As of March 31, 2008
Unit: NT$ Thousand
Five-Year Financial Information
Period
Item
2003 2004 2005 2006 2007
Current year as
of Mar 31, 2008
Current assets 68,295,983 85,029,907 139,242,560 161,267,661 191,626,201 188,093,047
Fund and Long-term Equity Investments 28,545,430 20,644,599 17,605,973 13,835,538 11,202,652 10,390,777
N
et Property, Plant and Equipment 14,107,056 13,446,980 9,468,157 6,190,501 8,636,441 7,719,062
Intangible Assets 1,039,357 784,296 501,878 396,682 25,926,493 25,389,337
Other Assets 5,260,271 4,555,507 4,763,374 6,809,916 5,891,555 5,996,766
Total Assets 117,248,097 124,461,289 171,581,942 188,500,298 243,283,342 237,588,989
Before Distribution 43,604,939 59,898,759 102,158,601 109,970,460 142,842,574 142,496,622
Current Liabilities
After Distribution 48,712,013 64,857,922 109,390,340 119,487,678 Un-appropriated Un-appropriated
Long-term Liabilities 7,264,870 257,007 146,623 168,627 16,790,876 12,406,734
Other Liabilities 1,891,077 2,087,804 2,027,268 2,805,428 6,240,899 6,295,056
Before Distribution 52,760,886 62,243,570 104,312,491 112,944,515 165,874,348 161,198,413
Total Liabilities
After Distribution 57,867,960 67,202,733 111,564,230 122,461,733 Un-appropriated Un-appropriated
Common Stock 20,650,877 20,933,677 22,545,187 23,370,637 24,054,904 24,054,904
Capital Surplus 33,433,750 30,541,969 30,552,132 29,947,020 29,898,983 29,891,872
Before Distribution 15,372,714 13,211,567 16,123,212 18,284,265 21,041,713 23,993,503
Retained Earnings
After Distribution 10,265,640 8,252,404 8,891,473 8,767,047 Un-appropriated Un-appropriated
Unrealized Gain (loss) on Financial assets (210,492) (731,426) 65,608 4,361,608 2,524,500 185,429
Translation Adjustments 491,763 132,516 (226,806) 1,335,500 2,733,899 728,503
Minimum Pension Liability adjustment (0) (0) (0) 0 (173,364) (169,766)
Treasury Stock (6,730,384) (3,411,280) (3,270,920) (3,270,920) (3,270,920) (3,270,920)
Minority Interest 1,478,983 1,540,696 1,461,038 1,527,674 599,280 977,051
Before Distribution 64,487,211 62,217,719 67,249,451 75,555,783 77,408,994 76,390,576
Stockholders’
Equity After Distribution 59,380,137 57,258,556 60,017,712 66,038,565 Un-appropriated Un-appropriated