Acer 2007 Annual Report Download - page 36
Download and view the complete annual report
Please find page 36 of the 2007 Acer annual report below. You can navigate through the pages in the report by either clicking on the pages listed below, or by using the keyword search tool below to find specific information within the annual report.-
 1
1 -
2
-
3
-
4
-
5
-
6
-
7
-
8
-
9
-
10
-
11
-
12
-
13
-
14
-
15
-
16
-
17
-
18
-
19
-
20
-
21
-
22
-
23
-
24
-
25
-
 26
26 -
 27
27 -
 28
28 -
 29
29 -
 30
30 -
 31
31 -
 32
32 -
 33
33 -
 34
34 -
 35
35 -
 36
36 -
 37
37 -
 38
38 -
 39
39 -
 40
40 -
 41
41 -
 42
42 -
 43
43 -
 44
44 -
 45
45 -
 46
46 -
47
-
48
-
49
-
50
-
51
-
52
-
53
-
54
-
55
-
56
-
57
-
58
-
59
-
60
-
61
-
62
-
63
-
64
-
65
-
66
-
67
-
68
-
69
-
70
-
71
-
72
-
73
-
74
-
75
-
76
-
77
-
78
-
79
-
80
-
81
-
82
-
83
-
84
-
85
-
86
-
87
-
88
-
89
-
90
-
91
-
92
-
93
-
94
-
95
-
96
-
97
-
98
-
99
-
100
-
101
-
102
-
103
-
104
-
105
-
106
-
107
-
108
-
109
-
110
-
111
-
112
-
113
-
114
-
115
-
116
-
117
 |
 |
33
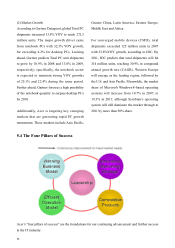
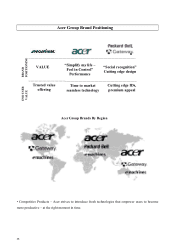
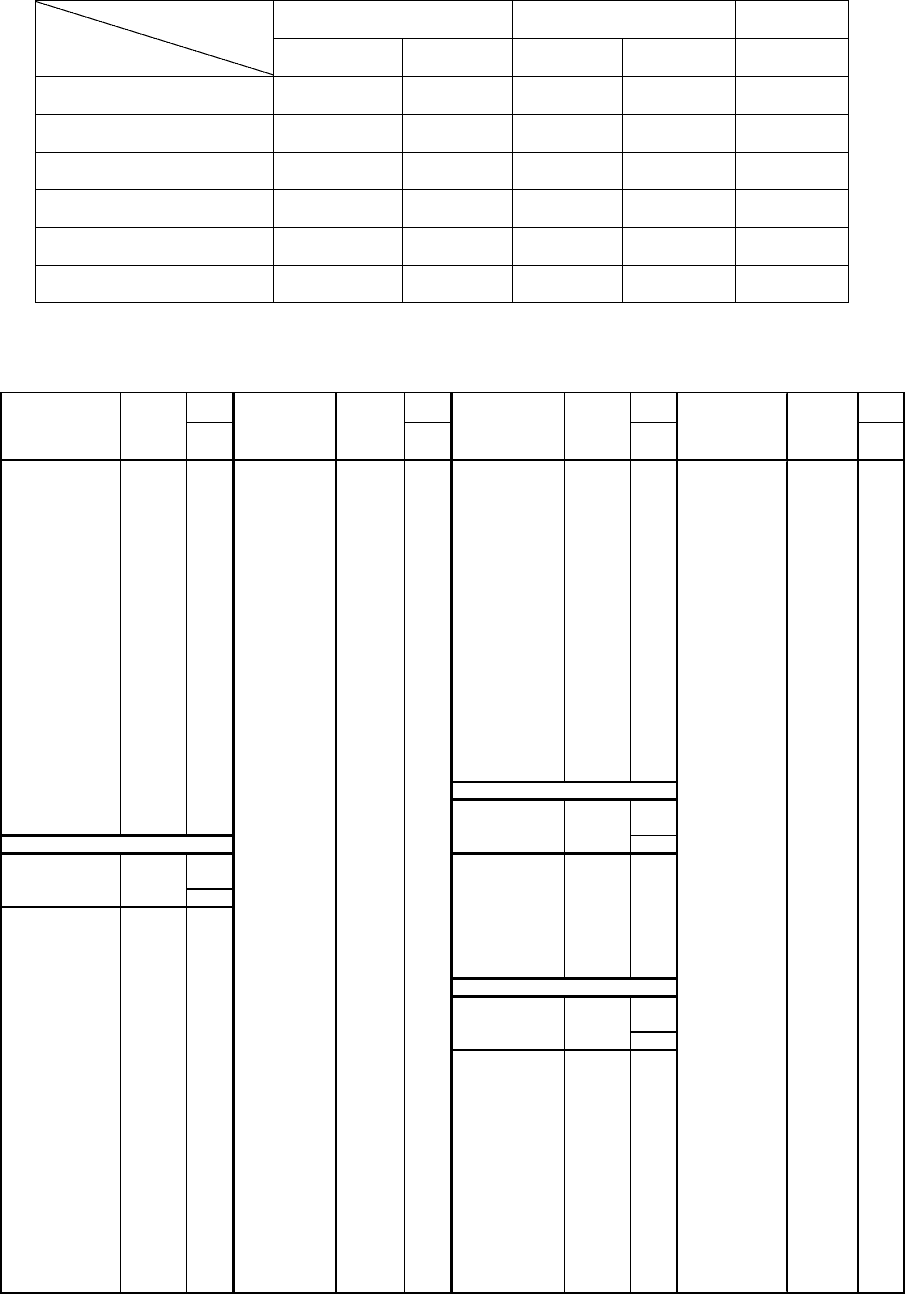
IT Product Revenue Breakdown – by Region
Unit: NT$ Million
※Excludes Taiwan, Hong Kong and Mainland China
† Includes revenue from Gateway in Q4, 2007
Ranking by unit shipment
Rank Rank Rank Rank
Worldwide PC 3 France PC 2 S
p
ain PC 2India PC 4
Desktop 4Desktop 2Desktop 3Desktop 5
Notebook 2Notebook 1Notebook 1Notebook 3
Asia/Pacific PC 4 Monitor 4Server 5Monitor 2
Notebook 3German
y
PC 3 Sweden PC 4Indonesia PC 1
Monitor 3Desktop 4Desktop 5Desktop 3
Projector 4Notebook 1Notebook 2Notebook 1
E. Euro
p
ePC 1 Monitor 5Switzerland PC 3Server 4
Notebook 1 Projector 1 Desktop 4Monotor 3
EMEA PC 2 Greece Notebook 3 Notebook 2Mala
y
sia PC 1
Desktop 3Projector 1Desktop 3
Notebook 1Hun
g
ar
y
PC 3 Turke
y
PC 3Notebook 1
Server 5 Notebook 1 Notebook 2Server 4
Projector 3 Projector 1 Projector 4Monitor 2
Monitor 4Israel Desktop 5 U. K. PC 3Projector 5
Latin America PC 4 Notebook 5 Desktop 3New Zealand PC 2
Notebook 2Ital
y
PC 2 Notebook 2Desktop 3
W. Euro
p
ePC 2 Desktop 2Monitor 4Notebook 2
Desktop 3Notebook 1Server 4
Notebook 1Server 5Pan America Projector 3
Server 5Netherlands PC 2 Phili
pp
ines PC 2
Desktop 3Rank Desktop 4
EMEA Notebook 1Canada PC 3 Notebook 1
Projector 2 Desktop 4 Server 5
Rank Norwa
y
PC 3 Notebook 4 Projector 1
Austria PC 4 Desktop 5 Monitor 1 Sin
g
a
p
ore PC 2
Notebook 2USA PC 4 Desktop 3
Notebook 2Poland PC 2 Desktop 5 Notebook 2
Notebook 1 Notebook 4 Monitor 2
Bel
g
ium PC 2 Portu
g
al PC 3Taiwan PC 1
Desktop 4Notebook 3AP Countries Desktop 1
Notebook 1Romania Projector 4Notebook 2
Rank Server 5
Denmark PC 2 Russia PC 1Australia PC 3 Monitor 3
Desktop 4Notebook 1Desktop 3Thailand PC 1
Notebook 2Monitor 2Notebook 3Desktop 2
Czech PC 1 Projector 1Server 5Notebook 1
Desktop 5Saudi Arabia Projector 2Monitor 2Server 4
Notebook 1China Notebook 5Monitor 1
Projector 2South Africa PC 2projector 2
Finland PC 3 Notebook 2Hong Kong PC 5 Vietnam PC 2
Desktop 5Projector 1Desktop 5Desktop 3
Notebook 2Notebook 1
Server 4
Source: Gartner Dataquest, 2007 Result; the Company Data
Form
Factor
Form
Factor
AP Countries Form
Factor
Form
Factor
EMEA
Countries
Form
Factor
Regions Form
Factor
EMEA
Countries
Form
Factor
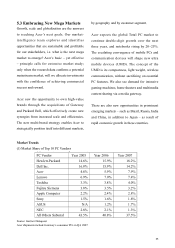
IT Product Revenue Breakdown – by RegionUnit: NT$ Million
Year 2006 Year 2007̙Growth
Region Revenue Weight Revenue Weight YoY
EMEA 194,953 60.6% 236,376 54.3% 21%
Pan America 55,707 17.3% 106,132 24.4% 91%
Asia Pacificϡ43,194 13.4% 59,562 13.7% 38%
China & Hong Kong 15,635 4.9% 21,543 5.0% +38%
Taiwan 11,976 3.8% 11,572 2.7% N/A
Total 321,466 100% 435,185 100.0% +35%
Excludes Taiwan, Hong Kong and Mainland China
̙
p
y
p
y
g y y
y
p
y
p
g
-3%