Acer 2007 Annual Report Download - page 29
Download and view the complete annual report
Please find page 29 of the 2007 Acer annual report below. You can navigate through the pages in the report by either clicking on the pages listed below, or by using the keyword search tool below to find specific information within the annual report.-
 1
1 -
2
-
3
-
4
-
5
-
6
-
7
-
8
-
9
-
10
-
11
-
12
-
13
-
14
-
15
-
16
-
17
-
18
-
 19
19 -
 20
20 -
 21
21 -
 22
22 -
 23
23 -
 24
24 -
 25
25 -
 26
26 -
 27
27 -
 28
28 -
 29
29 -
 30
30 -
 31
31 -
 32
32 -
 33
33 -
 34
34 -
 35
35 -
 36
36 -
 37
37 -
 38
38 -
 39
39 -
40
-
41
-
42
-
43
-
44
-
45
-
46
-
47
-
48
-
49
-
50
-
51
-
52
-
53
-
54
-
55
-
56
-
57
-
58
-
59
-
60
-
61
-
62
-
63
-
64
-
65
-
66
-
67
-
68
-
69
-
70
-
71
-
72
-
73
-
74
-
75
-
76
-
77
-
78
-
79
-
80
-
81
-
82
-
83
-
84
-
85
-
86
-
87
-
88
-
89
-
90
-
91
-
92
-
93
-
94
-
95
-
96
-
97
-
98
-
99
-
100
-
101
-
102
-
103
-
104
-
105
-
106
-
107
-
108
-
109
-
110
-
111
-
112
-
113
-
114
-
115
-
116
-
117
 |
 |

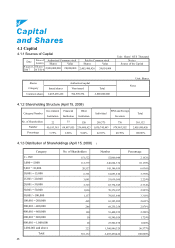
26
Unit: Share/ NT$ Thousand
Authorized Common stock Paid-in Common stock Note s
Date Price of
Issuance Shares Value Shares Value Source of the Capital
Aug u st,
2007
Sh a r e/
NT$ 1 0 2,800,000,000 28,000,000 2,405,490,426 24,054,904
Unit: Shares
Authorized capital
Shares
Category Issued shares Non-issued Total
Notes
Common shares 2,405,490,426 394,509,574 2,800,000,000
4.1.2 Shareholding Structure (April 15, 2008)
Category/Number
Government
Institution
Financial
Institution
Other
Institution
Individual
FINI and Foreign
Investors
Total
No. of Shareholders 22 33 526 299,775 776 301,132
Number 90,183,363 68,897,455 236,680,623 1,030,745,483 978,983,502 2,405,490,426
Percentage 3.75% 2.86% 9.84% 42.85% 40.70% 100.00%
4.1.3 Distribution of Shareholdings (April 15, 2008)
Category No. of Shareholders Number Percentage
1Д999 151,522 52,000,044 2.162%
1,000Д5,000 112,379 246,664,374 10.130%
5,001Д10,000 20,537 145,186,959 6.036%
10,001Д15,000 6,791 81,053,810 3.370%
15,001Д20,000 3,081 53,619,560 2.229%
20,001Д30,000 2,725 65,774,945 2.734%
30,001Д50,000 1,830 70,379,187 2.925%
50,001Д100,000 1,137 79,813,646 3.318%
100,001Д200,000 465 63,305,092 2.632%
200,001Д400,000 246 69,255,254 2.879%
400,001Д600,000 109 53,408,222 2.220%
600,001Д800,000 59 41,580,026 1.729%
800,001Д1,000,000 28 25,502,878 1.060%
1,000,001 and above 223 1,360,946,329 56.577%
Total 301,132 2,405,490,426 100.000%
4
Capital
and Shares
4.1 Capital
4.1.1 Sources of Capital
4.1.2 Shareholding Structure (April 15, 2008)
4.1.3 Distribution of Shareholdings (April 15, 2008)