XM Radio 2013 Annual Report Download - page 89
Download and view the complete annual report
Please find page 89 of the 2013 XM Radio annual report below. You can navigate through the pages in the report by either clicking on the pages listed below, or by using the keyword search tool below to find specific information within the annual report.-
 1
1 -
2
-
3
-
4
-
5
-
6
-
7
-
8
-
9
-
10
-
11
-
12
-
13
-
14
-
15
-
16
-
17
-
18
-
19
-
20
-
21
-
22
-
23
-
24
-
25
-
26
-
27
-
28
-
29
-
30
-
31
-
32
-
33
-
34
-
35
-
36
-
37
-
38
-
39
-
40
-
41
-
42
-
43
-
44
-
45
-
46
-
47
-
48
-
49
-
50
-
51
-
52
-
53
-
54
-
55
-
56
-
57
-
58
-
59
-
60
-
61
-
62
-
63
-
64
-
65
-
66
-
67
-
68
-
69
-
70
-
71
-
72
-
73
-
74
-
75
-
76
-
77
-
78
-
 79
79 -
 80
80 -
 81
81 -
 82
82 -
 83
83 -
 84
84 -
 85
85 -
 86
86 -
 87
87 -
 88
88 -
 89
89 -
 90
90 -
 91
91 -
 92
92 -
 93
93 -
 94
94 -
 95
95 -
 96
96 -
 97
97 -
 98
98 -
 99
99 -
100
-
101
-
102
-
103
-
104
-
105
-
106
-
107
-
108
-
109
-
110
-
111
-
112
-
113
-
114
-
115
-
116
-
117
-
118
-
119
-
120
-
121
-
122
-
123
-
124
-
125
-
126
-
127
-
128
-
129
-
130
-
131
-
132
-
133
-
134
-
135
-
136
 |
 |

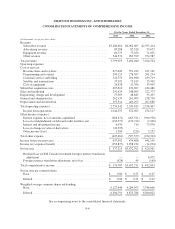
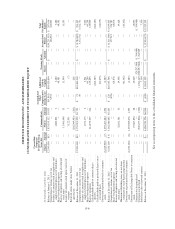
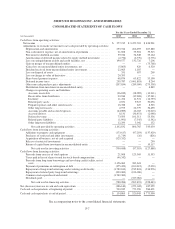
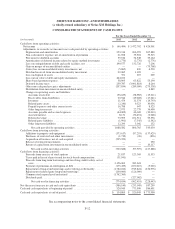
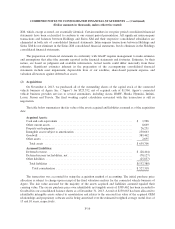
SIRIUS XM HOLDINGS INC. AND SUBSIDIARIES
CONSOLIDATED STATEMENTS OF CASH FLOWS
For the Years Ended December 31,
(in thousands) 2013 2012 2011
Cash flows from operating activities:
Net income ....................................................... $ 377,215 $ 3,472,702 $ 426,961
Adjustments to reconcile net income to net cash provided by operating activities:
Depreciation and amortization ...................................... 253,314 266,295 267,880
Non-cash interest expense, net of amortization of premium ................ 21,698 35,924 39,515
Provision for doubtful accounts ..................................... 39,016 34,548 33,164
Amortization of deferred income related to equity method investment ....... (2,776) (2,776) (2,776)
Loss on extinguishment of debt and credit facilities, net .................. 190,577 132,726 7,206
Gain on merger of unconsolidated entities ............................. — — (75,768)
(Gain) loss on unconsolidated entity investments, net .................... (5,865) 420 6,520
Dividend received from unconsolidated entity investment ................. 22,065 1,185 —
Loss on disposal of assets .......................................... 351 657 269
Loss on change in value of derivative ................................. 20,393 — —
Share-based payment expense ....................................... 68,876 63,822 53,190
Deferred income taxes ............................................. 259,787 (3,001,818) 8,264
Other non-cash purchase price adjustments ............................ (207,854) (289,050) (275,338)
Distribution from investment in unconsolidated entity .................... — — 4,849
Changes in operating assets and liabilities:
Accounts receivable ............................................ (36,189) (38,985) (13,211)
Receivables from distributors ..................................... 20,944 (19,608) (17,241)
Inventory ..................................................... 11,474 11,374 (14,793)
Related party assets ............................................. 2,031 9,523 30,036
Prepaid expenses and other current assets ............................ 16,788 647 8,525
Other long-term assets ........................................... 2,973 22,779 36,490
Accounts payable and accrued expenses ............................. (44,009) 46,043 (32,010)
Accrued interest ................................................ 8,131 (36,451) (2,048)
Deferred revenue ............................................... 73,593 101,311 55,336
Related party liabilities .......................................... (1,991) (7,545) (1,542)
Other long-term liabilities ........................................ 12,290 3,042 152
Net cash provided by operating activities .......................... 1,102,832 806,765 543,630
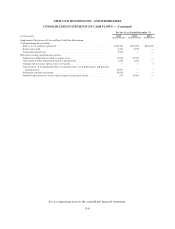
Cash flows from investing activities:
Additions to property and equipment ................................. (173,617) (97,293) (137,429)
Purchases of restricted and other investments ........................... (1,719) (26) (826)
Acquisition of business, net of cash acquired ........................... (525,352) — —
Release of restricted investments .................................... — — 250
Return of capital from investment in unconsolidated entity ................ — — 10,117
Net cash used in investing activities .............................. (700,688) (97,319) (127,888)
Cash flows from financing activities:
Proceeds from exercise of stock options ............................... 21,968 123,369 11,553
Taxes paid in lieu of shares issued for stock-based compensation ........... (46,342) — —
Proceeds from long-term borrowings and revolving credit facility, net of
costs ......................................................... 3,156,063 383,641 —
Payment of premiums on redemption of debt ........................... (175,453) (100,615) (5,020)
Repayment of long-term borrowings and revolving credit facility ........... (1,782,160) (915,824) (234,976)
Repayment of related party long-term borrowings ....................... (200,000) (126,000) —
Common stock repurchased and retired ............................... (1,762,360) — —
Dividends paid ................................................... — (327,062) —
Net cash used in financing activities .............................. (788,284) (962,491) (228,443)
Net (decrease) increase in cash and cash equivalents ......................... (386,140) (253,045) 187,299
Cash and cash equivalents at beginning of period ........................... 520,945 773,990 586,691
Cash and cash equivalents at end of period ................................. $ 134,805 $ 520,945 $ 773,990
See accompanying notes to the consolidated financial statements.
F-7