XM Radio 2013 Annual Report Download - page 60
Download and view the complete annual report
Please find page 60 of the 2013 XM Radio annual report below. You can navigate through the pages in the report by either clicking on the pages listed below, or by using the keyword search tool below to find specific information within the annual report.-
 1
1 -
2
-
3
-
4
-
5
-
6
-
7
-
8
-
9
-
10
-
11
-
12
-
13
-
14
-
15
-
16
-
17
-
18
-
19
-
20
-
21
-
22
-
23
-
24
-
25
-
26
-
27
-
28
-
29
-
30
-
31
-
32
-
33
-
34
-
35
-
36
-
37
-
38
-
39
-
40
-
41
-
42
-
43
-
44
-
45
-
46
-
47
-
48
-
49
-
 50
50 -
 51
51 -
 52
52 -
 53
53 -
 54
54 -
 55
55 -
 56
56 -
 57
57 -
 58
58 -
 59
59 -
 60
60 -
 61
61 -
 62
62 -
 63
63 -
 64
64 -
 65
65 -
 66
66 -
 67
67 -
 68
68 -
 69
69 -
 70
70 -
71
-
72
-
73
-
74
-
75
-
76
-
77
-
78
-
79
-
80
-
81
-
82
-
83
-
84
-
85
-
86
-
87
-
88
-
89
-
90
-
91
-
92
-
93
-
94
-
95
-
96
-
97
-
98
-
99
-
100
-
101
-
102
-
103
-
104
-
105
-
106
-
107
-
108
-
109
-
110
-
111
-
112
-
113
-
114
-
115
-
116
-
117
-
118
-
119
-
120
-
121
-
122
-
123
-
124
-
125
-
126
-
127
-
128
-
129
-
130
-
131
-
132
-
133
-
134
-
135
-
136
 |
 |
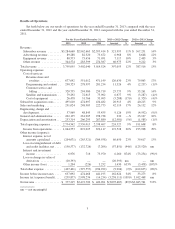
total revenue. The increase was primarily due to additional subscriber communications and retention
programs associated with a greater number of subscribers and promotional trials.
•2012 vs. 2011: For the years ended December 31, 2012 and 2011, sales and marketing expenses were
$248,905 and $222,773, respectively, an increase of 12%, or $26,132, and remained flat as a percentage
of total revenue. The increase was primarily due to additional subscriber communications and retention
programs associated with a greater number of subscribers and promotional trials, and higher OEM
cooperative marketing.
We anticipate that sales and marketing expenses will increase as changes in certain contractual marketing
agreements become effective and as we expand programs to retain our existing subscribers, win back former
subscribers, and attract new subscribers. We expect the increase in sales and marketing costs to be partially offset
by the impact of the expiration of the acquired executory contracts noted above.
Engineering, Design and Development includes costs to develop chip sets and new products and services,
research and development for broadcast information systems and costs associated with the incorporation of our
radios into new vehicles manufactured by automakers.
•2013 vs. 2012: For the years ended December 31, 2013 and 2012, engineering, design and development
expenses were $57,969 and $48,843, respectively, an increase of 19%, or $9,126, but remained flat as a
percentage of total revenue. The increase was driven primarily by higher product development costs,
costs related to enhanced subscriber features and functionality for our service, and by the reversal of
certain non-recurring engineering charges that were recorded in the second quarter of 2012.
•2012 vs. 2011: For the years ended December 31, 2012 and 2011, engineering, design and development
expenses were $48,843 and $53,435, respectively, a decrease of 9%, or $4,592, and decreased as a
percentage of total revenue. The decrease was driven primarily by a reversal of certain non-recurring
engineering charges, partially offset by higher product development costs, costs related to the
development of enhanced subscriber features and functionality for our service and higher personnel costs.
We expect engineering, design and development expenses to increase in future periods as we continue to
develop our products and services.
General and Administrative includes executive management, rent and occupancy, finance, legal, human
resources, information technology, and insurance costs.
•2013 vs. 2012: For the years ended December 31, 2013 and 2012, general and administrative expenses
were $262,135 and $261,905, respectively, an increase of less than 1%, or $230, but decreased as a
percentage of total revenue. The increase was primarily due to higher information technology costs, offset
by lower legal costs.
•2012 vs. 2011: For the years ended December 31, 2012 and 2011, general and administrative expenses
were $261,905 and $238,738, respectively, an increase of 10%, or $23,167, but remained flat as a
percentage of total revenue. The increase was primarily due to higher personnel costs, including share-
based payment expenses, office rent expenses and professional fees, partially offset by lower litigation
settlement charges.
We expect our general and administrative expenses to increase in future periods as a result of, among other
things, enhanced information technology, on-going legal costs and personnel costs to support the growth of our
business.
Depreciation and Amortization represents the recognition in earnings of the acquisition cost of assets used
in operations, including our satellite constellations, property, equipment and intangible assets, over their
estimated service lives.
•2013 vs. 2012: For the years ended December 31, 2013 and 2012, depreciation and amortization
expense was $253,314 and $266,295, respectively, a decrease of 5%, or $12,981, and decreased as a
8