XM Radio 2013 Annual Report Download - page 65
Download and view the complete annual report
Please find page 65 of the 2013 XM Radio annual report below. You can navigate through the pages in the report by either clicking on the pages listed below, or by using the keyword search tool below to find specific information within the annual report.-
 1
1 -
2
-
3
-
4
-
5
-
6
-
7
-
8
-
9
-
10
-
11
-
12
-
13
-
14
-
15
-
16
-
17
-
18
-
19
-
20
-
21
-
22
-
23
-
24
-
25
-
26
-
27
-
28
-
29
-
30
-
31
-
32
-
33
-
34
-
35
-
36
-
37
-
38
-
39
-
40
-
41
-
42
-
43
-
44
-
45
-
46
-
47
-
48
-
49
-
50
-
51
-
52
-
53
-
54
-
 55
55 -
 56
56 -
 57
57 -
 58
58 -
 59
59 -
 60
60 -
 61
61 -
 62
62 -
 63
63 -
 64
64 -
 65
65 -
 66
66 -
 67
67 -
 68
68 -
 69
69 -
 70
70 -
 71
71 -
 72
72 -
 73
73 -
 74
74 -
 75
75 -
76
-
77
-
78
-
79
-
80
-
81
-
82
-
83
-
84
-
85
-
86
-
87
-
88
-
89
-
90
-
91
-
92
-
93
-
94
-
95
-
96
-
97
-
98
-
99
-
100
-
101
-
102
-
103
-
104
-
105
-
106
-
107
-
108
-
109
-
110
-
111
-
112
-
113
-
114
-
115
-
116
-
117
-
118
-
119
-
120
-
121
-
122
-
123
-
124
-
125
-
126
-
127
-
128
-
129
-
130
-
131
-
132
-
133
-
134
-
135
-
136
 |
 |

We believe these Non-GAAP financial measures provide useful information to investors regarding our
financial condition and results of operations. We believe investors find these Non-GAAP financial performance
measures useful in evaluating our core trends because it provides a direct view of our underlying contractual
costs. We believe investors use our current and projected adjusted EBITDA to estimate our current or prospective
enterprise value and to make investment decisions. By providing these Non-GAAP financial measures, together
with the reconciliations to the most directly comparable GAAP measure, we believe we are enhancing investors’
understanding of our business and our results of operations.
These Non-GAAP financial measures should be viewed in addition to, and not as an alternative for or
superior to, our reported results prepared in accordance with GAAP. In addition, these Non-GAAP financial
measures may not be comparable to similarly-titled measures by other companies. Please refer to the glossary
(pages 19 through 25) for a further discussion of such Non-GAAP financial measures and reconciliations to the
most directly comparable GAAP measure.
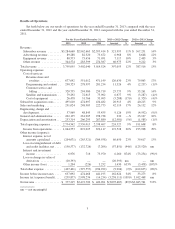
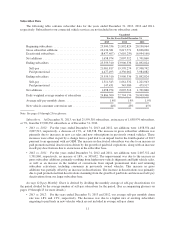
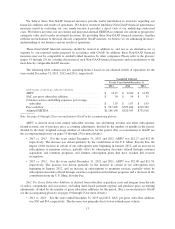
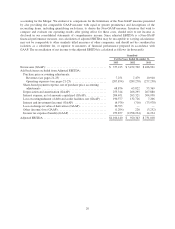
The following table contains our key operating metrics based on our adjusted results of operations for the
years ended December 31, 2013, 2012 and 2011, respectively:
Unaudited Adjusted
For the Years Ended December 31,
2013 2012 2011
(in thousands, except for per subscriber amounts)
ARPU ............................................ $ 12.27 $ 12.00 $ 11.58
SAC, per gross subscriber addition ...................... $ 50 $ 54 $ 55
Customer service and billing expenses, per average
subscriber ....................................... $ 1.07 $ 1.07 $ 1.03
Free cash flow ...................................... $ 927,496 $709,446 $415,742
Adjusted EBITDA ................................... $1,166,140 $920,343 $731,018
Note: See pages 19 through 25 for a reconciliation to GAAP in the accompanying glossary.
ARPU is derived from total earned subscriber revenue, net advertising revenue and other subscription-
related revenue, net of purchase price accounting adjustments, divided by the number of months in the period,
divided by the daily weighted average number of subscribers for the period. (For a reconciliation to GAAP see
the accompanying glossary on pages 19 through 25 for more details.)
•2013 vs. 2012: For the years ended December 31, 2013 and 2012, ARPU was $12.27 and $12.00,
respectively. The increase was driven primarily by the contribution of the U.S. Music Royalty Fee, the
impact of the increase in certain of our subscription rates beginning in January 2012, and an increase in
subscriptions to premium services, partially offset by subscription discounts offered through customer
acquisition and retention programs, and lifetime subscription plans that have reached full revenue
recognition.
•2012 vs. 2011: For the years ended December 31, 2012 and 2011, ARPU was $12.00 and $11.58,
respectively. The increase was driven primarily by the increase in certain of our subscription rates
beginning in January 2012, and an increase in subscriptions to premium services, partially offset by
subscription discounts offered through customer acquisition and retention programs and a decrease in the
contribution from the U.S. Music Royalty Fee.
SAC, Per Gross Subscriber Addition, is derived from subscriber acquisition costs and margins from the sale
of radios, components and accessories, excluding share-based payment expense and purchase price accounting
adjustments, divided by the number of gross subscriber additions for the period. (For a reconciliation to GAAP
see the accompanying glossary on pages 19 through 25 for more details.)
•2013 vs. 2012: For the years ended December 31, 2013 and 2012, SAC, per gross subscriber addition,
was $50 and $54, respectively. The decrease was primarily due to lower subsidies per vehicle.
13