XM Radio 2013 Annual Report Download - page 72
Download and view the complete annual report
Please find page 72 of the 2013 XM Radio annual report below. You can navigate through the pages in the report by either clicking on the pages listed below, or by using the keyword search tool below to find specific information within the annual report.-
 1
1 -
2
-
3
-
4
-
5
-
6
-
7
-
8
-
9
-
10
-
11
-
12
-
13
-
14
-
15
-
16
-
17
-
18
-
19
-
20
-
21
-
22
-
23
-
24
-
25
-
26
-
27
-
28
-
29
-
30
-
31
-
32
-
33
-
34
-
35
-
36
-
37
-
38
-
39
-
40
-
41
-
42
-
43
-
44
-
45
-
46
-
47
-
48
-
49
-
50
-
51
-
52
-
53
-
54
-
55
-
56
-
57
-
58
-
59
-
60
-
61
-
 62
62 -
 63
63 -
 64
64 -
 65
65 -
 66
66 -
 67
67 -
 68
68 -
 69
69 -
 70
70 -
 71
71 -
 72
72 -
 73
73 -
 74
74 -
 75
75 -
 76
76 -
 77
77 -
 78
78 -
 79
79 -
 80
80 -
 81
81 -
 82
82 -
83
-
84
-
85
-
86
-
87
-
88
-
89
-
90
-
91
-
92
-
93
-
94
-
95
-
96
-
97
-
98
-
99
-
100
-
101
-
102
-
103
-
104
-
105
-
106
-
107
-
108
-
109
-
110
-
111
-
112
-
113
-
114
-
115
-
116
-
117
-
118
-
119
-
120
-
121
-
122
-
123
-
124
-
125
-
126
-
127
-
128
-
129
-
130
-
131
-
132
-
133
-
134
-
135
-
136
 |
 |

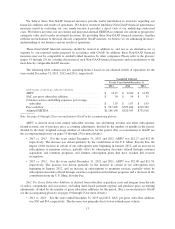
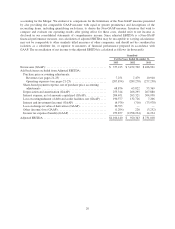
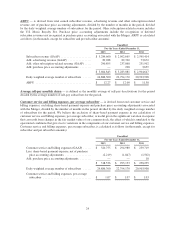
accounting for the Merger. We endeavor to compensate for the limitations of the Non-GAAP measure presented
by also providing the comparable GAAP measure with equal or greater prominence and descriptions of the
reconciling items, including quantifying such items, to derive the Non-GAAP measure. Investors that wish to
compare and evaluate our operating results after giving effect for these costs, should refer to net income as
disclosed in our consolidated statements of comprehensive income. Since adjusted EBITDA is a Non-GAAP
financial performance measure, our calculation of adjusted EBITDA may be susceptible to varying calculations;
may not be comparable to other similarly titled measures of other companies; and should not be considered in
isolation, as a substitute for, or superior to measures of financial performance prepared in accordance with
GAAP. The reconciliation of net income to the adjusted EBITDA is calculated as follows (in thousands):
Unaudited
For the Years Ended December 31,
2013 2012 2011
Net income (GAAP): ......................................... $ 377,215 $ 3,472,702 $ 426,961
Add back items excluded from Adjusted EBITDA:
Purchase price accounting adjustments:
Revenues (see pages 21-23) ............................... 7,251 7,479 10,910
Operating expenses (see pages 21-23) ....................... (207,854) (289,278) (277,258)
Share-based payment expense, net of purchase price accounting
adjustments ............................................ 68,876 63,822 53,369
Depreciation and amortization (GAAP) ........................ 253,314 266,295 267,880
Interest expense, net of amounts capitalized (GAAP) .............. 204,671 265,321 304,938
Loss on extinguishment of debt and credit facilities, net (GAAP) .... 190,577 132,726 7,206
Interest and investment (income) (GAAP) ...................... (6,976) (716) (73,970)
Loss on change in value of derivatives (GAAP) .................. 20,393 — —
Other (income) loss (GAAP) ................................. (1,204) 226 (3,252)
Income tax expense (benefit) (GAAP) ......................... 259,877 (2,998,234) 14,234
Adjusted EBITDA ........................................... $1,166,140 $ 920,343 $ 731,018
20