XM Radio 2013 Annual Report Download - page 88
Download and view the complete annual report
Please find page 88 of the 2013 XM Radio annual report below. You can navigate through the pages in the report by either clicking on the pages listed below, or by using the keyword search tool below to find specific information within the annual report.-
 1
1 -
2
-
3
-
4
-
5
-
6
-
7
-
8
-
9
-
10
-
11
-
12
-
13
-
14
-
15
-
16
-
17
-
18
-
19
-
20
-
21
-
22
-
23
-
24
-
25
-
26
-
27
-
28
-
29
-
30
-
31
-
32
-
33
-
34
-
35
-
36
-
37
-
38
-
39
-
40
-
41
-
42
-
43
-
44
-
45
-
46
-
47
-
48
-
49
-
50
-
51
-
52
-
53
-
54
-
55
-
56
-
57
-
58
-
59
-
60
-
61
-
62
-
63
-
64
-
65
-
66
-
67
-
68
-
69
-
70
-
71
-
72
-
73
-
74
-
75
-
76
-
77
-
 78
78 -
 79
79 -
 80
80 -
 81
81 -
 82
82 -
 83
83 -
 84
84 -
 85
85 -
 86
86 -
 87
87 -
 88
88 -
 89
89 -
 90
90 -
 91
91 -
 92
92 -
 93
93 -
 94
94 -
 95
95 -
 96
96 -
 97
97 -
 98
98 -
99
-
100
-
101
-
102
-
103
-
104
-
105
-
106
-
107
-
108
-
109
-
110
-
111
-
112
-
113
-
114
-
115
-
116
-
117
-
118
-
119
-
120
-
121
-
122
-
123
-
124
-
125
-
126
-
127
-
128
-
129
-
130
-
131
-
132
-
133
-
134
-
135
-
136
 |
 |

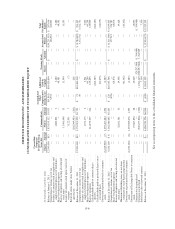
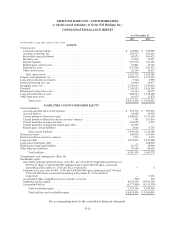
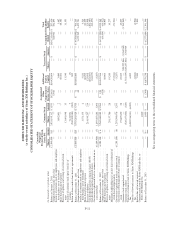
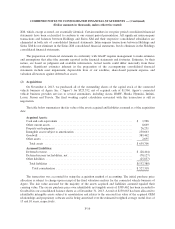
SIRIUS XM HOLDINGS INC. AND SUBSIDIARIES
CONSOLIDATED STATEMENT OF STOCKHOLDERS’ EQUITY
Convertible
Perpetual
Preferred Stock,
Series B-1 Common Stock
Accumulated
Other
Comprehensive
Income (Loss)
Additional
Paid-in
Capital
Treasury Stock Accumulated
Deficit
Total
Stockholders’
Equity(in thousands, except share data) Shares Amount Shares Amount Shares Amount
Balance at January 1, 2011 ................ 12,500,000 $13 3,933,195,112 $3,933 $(5,861) $10,420,604 — $ — $(10,211,053) $ 207,636
Comprehensive income, net of tax ........... — — — — 5,932 — — — 426,961 432,893
Issuance of common stock to employees and
employee benefit plans, net of forfeitures . . . — — 1,882,801 2 — 3,480 — — — 3,482
Share-based payment expense .............. — — — — — 48,581 — — — 48,581
Exercise of options and vesting of restricted
stock units ........................... — — 13,401,048 13 — 11,540 — — — 11,553
Issuance of common stock upon exercise of
warrants ............................. — — 7,122,951 7 — (7) — — — —
Return of shares under share borrow
agreements ........................... — — (202,399,983) (202) — 202 — — — —
Balance at December 31, 2011 ............. 12,500,000 $13 3,753,201,929 $3,753 $ 71 $10,484,400 — $ — $ (9,784,092) $ 704,145
Comprehensive income, net of tax ........... — — — — 49 — — — 3,472,702 3,472,751
Issuance of common stock to employees and
employee benefit plans, net of forfeitures . . . — — 1,571,175 2 — 3,521 — — — 3,523
Share-based payment expense .............. — — — — — 60,299 — — — 60,299
Exercise of options ....................... — — 214,199,297 214 — 125,695 — — — 125,909
Cash dividends paid on common shares
($0.05) .............................. — — — — — (262,387) — — — (262,387)
Cash dividends paid on preferred shares on as-
converted basis ........................ — — — — — (64,675) — — — (64,675)
Conversion of preferred stock to common
stock ................................ (6,249,900) (7) 1,293,467,684 1,294 — (1,287) — — — —
Balance at December 31, 2012 ............. 6,250,100 $ 6 5,262,440,085 $5,263 $ 120 $10,345,566 — $ — $ (6,311,390) $ 4,039,565
Comprehensive income, net of tax ........... — — — — (428) — — — 377,215 376,787
Share-based payment expense .............. — — — — — 68,876 — — — 68,876
Exercise of options and vesting of restricted
stock units ........................... — — 32,841,381 32 — 19,396 — — — 19,428
Minimum withholding taxes on net share
settlement of stock-based compensation .... — — — — — (46,342) — — — (46,342)
Conversion of preferred stock to common
stock ................................ (6,250,100) (6) 1,293,509,076 1,293 — (1,287) — — — —
Conversion of Exchangeable Notes to common
stock ................................ — — 27,687,850 28 — 45,069 — — — 45,097
Common stock repurchased ................ — — — — — — 520,257,866 (1,764,969) — (1,764,969)
Common stock retired .................... — — (520,257,866) (520) — (1,764,449) (520,257,866) 1,764,969 — —
Initial fair value of forward contract ......... — — — — — 7,300 — — — 7,300
Balance at December 31, 2013 ............. — $— 6,096,220,526 $6,096 $ (308) $ 8,674,129 — $ — $ (5,934,175) $ 2,745,742
See accompanying notes to the consolidated financial statements.
F-6