XM Radio 2013 Annual Report Download - page 73
Download and view the complete annual report
Please find page 73 of the 2013 XM Radio annual report below. You can navigate through the pages in the report by either clicking on the pages listed below, or by using the keyword search tool below to find specific information within the annual report.-
 1
1 -
2
-
3
-
4
-
5
-
6
-
7
-
8
-
9
-
10
-
11
-
12
-
13
-
14
-
15
-
16
-
17
-
18
-
19
-
20
-
21
-
22
-
23
-
24
-
25
-
26
-
27
-
28
-
29
-
30
-
31
-
32
-
33
-
34
-
35
-
36
-
37
-
38
-
39
-
40
-
41
-
42
-
43
-
44
-
45
-
46
-
47
-
48
-
49
-
50
-
51
-
52
-
53
-
54
-
55
-
56
-
57
-
58
-
59
-
60
-
61
-
62
-
 63
63 -
 64
64 -
 65
65 -
 66
66 -
 67
67 -
 68
68 -
 69
69 -
 70
70 -
 71
71 -
 72
72 -
 73
73 -
 74
74 -
 75
75 -
 76
76 -
 77
77 -
 78
78 -
 79
79 -
 80
80 -
 81
81 -
 82
82 -
 83
83 -
84
-
85
-
86
-
87
-
88
-
89
-
90
-
91
-
92
-
93
-
94
-
95
-
96
-
97
-
98
-
99
-
100
-
101
-
102
-
103
-
104
-
105
-
106
-
107
-
108
-
109
-
110
-
111
-
112
-
113
-
114
-
115
-
116
-
117
-
118
-
119
-
120
-
121
-
122
-
123
-
124
-
125
-
126
-
127
-
128
-
129
-
130
-
131
-
132
-
133
-
134
-
135
-
136
 |
 |

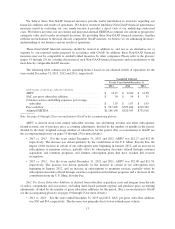
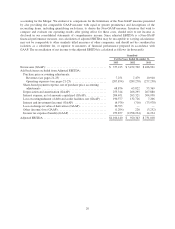
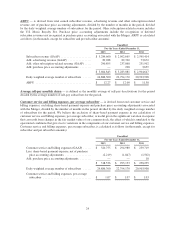
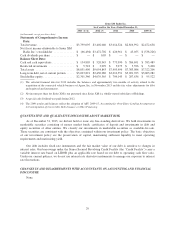
Adjusted Revenues and Operating Expenses — We define this Non-GAAP financial measure as our actual
revenues and operating expenses adjusted to exclude the impact of certain purchase price accounting adjustments
and share-based payment expense. We use this Non-GAAP financial measure to manage our business, to set
operational goals and as a basis for determining performance-based compensation for our employees. The
following tables reconcile our actual revenues and operating expenses to our adjusted revenues and operating
expenses for the years ended December 31, 2013, 2012 and 2011:
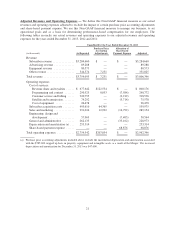
Unaudited For the Year Ended December 31, 2013
(in thousands) As Reported
Purchase Price
Accounting
Adjustments
Allocation of
Share-based
Payment Expense Adjusted
Revenue:
Subscriber revenue ............... $3,284,660 $ — $ — $3,284,660
Advertising revenue .............. 89,288 — — 89,288
Equipment revenue .............. 80,573 — — 80,573
Other revenue ................... 344,574 7,251 — 351,825
Total revenue ..................... $3,799,095 $ 7,251 $ — $3,806,346
Operating expenses
Cost of services:
Revenue share and royalties ...... $ 677,642 $122,534 $ — $ 800,176
Programming and content ....... 290,323 8,033 (7,584) 290,772
Customer service and billing ..... 320,755 — (2,219) 318,536
Satellite and transmission ........ 79,292 — (3,714) 75,578
Cost of equipment ............. 26,478 — — 26,478
Subscriber acquisition costs ........ 495,610 64,365 — 559,975
Sales and marketing .............. 291,024 12,922 (14,792) 289,154
Engineering, design and
development .................. 57,969 — (7,405) 50,564
General and administrative ........ 262,135 — (33,162) 228,973
Depreciation and amortization (a) . . . 253,314 — — 253,314
Share-based payment expense ...... — — 68,876 68,876
Total operating expenses ............ $2,754,542 $207,854 $ — $2,962,396
(a) Purchase price accounting adjustments included above exclude the incremental depreciation and amortization associated
with the $785,000 stepped up basis in property, equipment and intangible assets as a result of the Merger. The increased
depreciation and amortization for December 31, 2013 was $47,000.
21