XM Radio 2013 Annual Report Download - page 63
Download and view the complete annual report
Please find page 63 of the 2013 XM Radio annual report below. You can navigate through the pages in the report by either clicking on the pages listed below, or by using the keyword search tool below to find specific information within the annual report.-
 1
1 -
2
-
3
-
4
-
5
-
6
-
7
-
8
-
9
-
10
-
11
-
12
-
13
-
14
-
15
-
16
-
17
-
18
-
19
-
20
-
21
-
22
-
23
-
24
-
25
-
26
-
27
-
28
-
29
-
30
-
31
-
32
-
33
-
34
-
35
-
36
-
37
-
38
-
39
-
40
-
41
-
42
-
43
-
44
-
45
-
46
-
47
-
48
-
49
-
50
-
51
-
52
-
 53
53 -
 54
54 -
 55
55 -
 56
56 -
 57
57 -
 58
58 -
 59
59 -
 60
60 -
 61
61 -
 62
62 -
 63
63 -
 64
64 -
 65
65 -
 66
66 -
 67
67 -
 68
68 -
 69
69 -
 70
70 -
 71
71 -
 72
72 -
 73
73 -
74
-
75
-
76
-
77
-
78
-
79
-
80
-
81
-
82
-
83
-
84
-
85
-
86
-
87
-
88
-
89
-
90
-
91
-
92
-
93
-
94
-
95
-
96
-
97
-
98
-
99
-
100
-
101
-
102
-
103
-
104
-
105
-
106
-
107
-
108
-
109
-
110
-
111
-
112
-
113
-
114
-
115
-
116
-
117
-
118
-
119
-
120
-
121
-
122
-
123
-
124
-
125
-
126
-
127
-
128
-
129
-
130
-
131
-
132
-
133
-
134
-
135
-
136
 |
 |

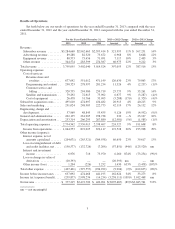
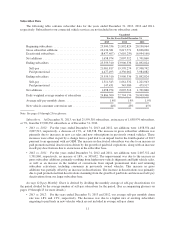
Subscriber Data
The following table contains subscriber data for the years ended December 31, 2013, 2012 and 2011,
respectively. Subscribers to our connected vehicle services are not included in our subscriber count:
Unaudited
For the Years Ended December 31,
2013 2012 2011
Beginning subscribers ............................. 23,900,336 21,892,824 20,190,964
Gross subscriber additions ......................... 10,136,381 9,617,771 8,696,020
Deactivated subscribers ............................ (8,477,407) (7,610,259) (6,994,160)
Net additions .................................... 1,658,974 2,007,512 1,701,860
Ending subscribers ............................... 25,559,310 23,900,336 21,892,824
Self-pay ...................................... 21,081,817 19,570,274 17,908,742
Paid promotional ............................... 4,477,493 4,330,062 3,984,082
Ending subscribers ............................... 25,559,310 23,900,336 21,892,824
Self-pay ...................................... 1,511,543 1,661,532 1,221,943
Paid promotional ............................... 147,431 345,980 479,917
Net additions .................................... 1,658,974 2,007,512 1,701,860
Daily weighted average number of subscribers ......... 24,886,300 22,794,170 20,903,908
Average self-pay monthly churn ..................... 1.8% 1.9% 1.9%
New vehicle consumer conversion rate ................ 44% 45% 45%
Note: See pages 19 through 25 for glossary.
Subscribers. At December 31, 2013, we had 25,559,310 subscribers, an increase of 1,658,974 subscribers,
or 7%, from the 23,900,336 subscribers as of December 31, 2012.
•2013 vs. 2012: For the years ended December 31, 2013 and 2012, net additions were 1,658,974 and
2,007,512, respectively, a decrease of 17%, or 348,538. The increase in gross subscriber additions was
primarily due to increases in new car sales and new subscriptions in previously owned vehicles. These
increases were offset in part by a change from a paid trial to an unpaid trial in the fourth quarter of 2013
pursuant to an agreement with an OEM. The increase in deactivated subscribers was due to an increase in
paid promotional trial deactivations driven by the growth of paid trial expirations, along with an increase
in self-pay deactivations due to an increase in the subscriber base.
•2012 vs. 2011: For the years ended December 31, 2012 and 2011, net additions were 2,007,512 and
1,701,860, respectively, an increase of 18%, or 305,652. The improvement was due to the increase in
gross subscriber additions, primarily resulting from higher new vehicle shipments and light vehicle sales,
as well as an increase in the number of conversions from unpaid promotional trials and returning
subscriber activations, including consumers in previously owned vehicles. This increase in gross
additions was partially offset by an increase in deactivations. The increase in deactivations was primarily
due to paid promotional trial deactivations stemming from the growth of paid trials and increased self-pay
deactivations from our larger subscriber base.
Average Self-pay Monthly Churn is derived by dividing the monthly average of self-pay deactivations for
the period divided by the average number of self-pay subscribers for the period. (See accompanying glossary on
pages 19 through 25 for more details.)
•2013 vs. 2012: For the years ended December 31, 2013 and 2012, our average self-pay monthly churn
rate was 1.8% and 1.9%, respectively. The decrease was due to a higher mix of existing subscribers
migrating to paid trials in new vehicles which are not included in average self-pay churn.
11