XM Radio 2013 Annual Report Download - page 61
Download and view the complete annual report
Please find page 61 of the 2013 XM Radio annual report below. You can navigate through the pages in the report by either clicking on the pages listed below, or by using the keyword search tool below to find specific information within the annual report.-
 1
1 -
2
-
3
-
4
-
5
-
6
-
7
-
8
-
9
-
10
-
11
-
12
-
13
-
14
-
15
-
16
-
17
-
18
-
19
-
20
-
21
-
22
-
23
-
24
-
25
-
26
-
27
-
28
-
29
-
30
-
31
-
32
-
33
-
34
-
35
-
36
-
37
-
38
-
39
-
40
-
41
-
42
-
43
-
44
-
45
-
46
-
47
-
48
-
49
-
50
-
 51
51 -
 52
52 -
 53
53 -
 54
54 -
 55
55 -
 56
56 -
 57
57 -
 58
58 -
 59
59 -
 60
60 -
 61
61 -
 62
62 -
 63
63 -
 64
64 -
 65
65 -
 66
66 -
 67
67 -
 68
68 -
 69
69 -
 70
70 -
 71
71 -
72
-
73
-
74
-
75
-
76
-
77
-
78
-
79
-
80
-
81
-
82
-
83
-
84
-
85
-
86
-
87
-
88
-
89
-
90
-
91
-
92
-
93
-
94
-
95
-
96
-
97
-
98
-
99
-
100
-
101
-
102
-
103
-
104
-
105
-
106
-
107
-
108
-
109
-
110
-
111
-
112
-
113
-
114
-
115
-
116
-
117
-
118
-
119
-
120
-
121
-
122
-
123
-
124
-
125
-
126
-
127
-
128
-
129
-
130
-
131
-
132
-
133
-
134
-
135
-
136
 |
 |
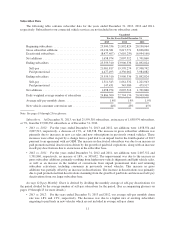
percentage of total revenue. The decrease was driven by certain satellites reaching the end of their
estimated service lives, partially offset by additional assets placed in-service.
•2012 vs. 2011: For the years ended December 31, 2012 and 2011, depreciation and amortization
expense was $266,295 and $267,880, respectively, a decrease of 1%, or $1,585, and decreased as a
percentage of total revenue. The decrease was driven by reductions in the amortization of subscriber
relationships and depreciation recognized on assets placed in-service as certain assets reached the end of
their estimated service lives.
We expect depreciation expense to decrease in future periods due to reduced amortization associated with
the stepped-up basis in assets acquired in the Merger (including intangible assets, satellites, property and
equipment) through the end of their estimated service lives, principally through 2017. These decreases will be
partially offset by increased depreciation resulting from our FM-6 satellite being placed into service.
Other Income (Expense)
Interest Expense, Net of Amounts Capitalized, includes interest on outstanding debt, reduced by interest
capitalized in connection with the construction of satellites and related launch vehicles.
•2013 vs. 2012: For the years ended December 31, 2013 and 2012, interest expense was $204,671 and
$265,321, respectively, a decrease of 23%, or $60,650. The decrease was primarily due to lower average
interest rates resulting from the redemption or repayment of $2,535,500 of higher interest rate debt
throughout 2012 and 2013, which was replaced with $2,650,000 of lower interest rate debt.
•2012 vs. 2011: For the years ended December 31, 2012 and 2011, interest expense was $265,321 and
$304,938, respectively, a decrease of 13%, or $39,617. The decrease was primarily due to a lower
average outstanding debt balance and a mix of outstanding debt with lower interest rates.
We expect interest expense to increase in future periods as total debt outstanding increases and we cease to
capitalize interest associated with satellite construction.
Loss on Extinguishment of Debt and Credit Facilities, Net, includes losses incurred as a result of the
conversion and retirement of certain debt.
•2013 vs. 2012: For the year ended December 31, 2013, loss on extinguishment of debt and credit
facilities, net, was $190,577. The loss in 2013 was recorded on the repayment and redemption of our
7.625% Senior Notes due 2018 and our 8.75% Senior Notes due 2015. During the year ended
December 31, 2012, a $132,726 loss was recorded on the repayment of our 13% Senior Notes due 2013
and our 9.75% Senior Secured Notes due 2015.
•2012 vs. 2011: For the year ended December 31, 2012, loss on extinguishment of debt and credit
facilities, net, was $132,726. The loss was recorded on the repayment of our 13% Senior Notes due 2013
and our 9.75% Senior Secured Notes due 2015. During the year ended December 31, 2011, a $7,206 loss
was recorded on the repayment of our 11.25% Senior Secured Notes due 2013 and our 3.25% Convertible
Notes due 2011.
Interest and Investment Income includes realized gains and losses, interest income, and our share of the
income of Sirius XM Canada.
•2013 vs. 2012: For the year ended December 31, 2013, interest and investment income was $6,976
compared to $716 in 2012. The interest and investment income for 2013 and 2012 was primarily due to
our share of Sirius XM Canada’s net income, partially offset by the amortization expense related to our
equity method intangible assets.
•2012 vs. 2011: For the year ended December 31, 2012, interest and investment income was $716
compared to $73,970 in 2011. The interest and investment income for 2012 was primarily due to interest
9