XM Radio 2013 Annual Report Download - page 80
Download and view the complete annual report
Please find page 80 of the 2013 XM Radio annual report below. You can navigate through the pages in the report by either clicking on the pages listed below, or by using the keyword search tool below to find specific information within the annual report.-
 1
1 -
2
-
3
-
4
-
5
-
6
-
7
-
8
-
9
-
10
-
11
-
12
-
13
-
14
-
15
-
16
-
17
-
18
-
19
-
20
-
21
-
22
-
23
-
24
-
25
-
26
-
27
-
28
-
29
-
30
-
31
-
32
-
33
-
34
-
35
-
36
-
37
-
38
-
39
-
40
-
41
-
42
-
43
-
44
-
45
-
46
-
47
-
48
-
49
-
50
-
51
-
52
-
53
-
54
-
55
-
56
-
57
-
58
-
59
-
60
-
61
-
62
-
63
-
64
-
65
-
66
-
67
-
68
-
69
-
 70
70 -
 71
71 -
 72
72 -
 73
73 -
 74
74 -
 75
75 -
 76
76 -
 77
77 -
 78
78 -
 79
79 -
 80
80 -
 81
81 -
 82
82 -
 83
83 -
 84
84 -
 85
85 -
 86
86 -
 87
87 -
 88
88 -
 89
89 -
 90
90 -
91
-
92
-
93
-
94
-
95
-
96
-
97
-
98
-
99
-
100
-
101
-
102
-
103
-
104
-
105
-
106
-
107
-
108
-
109
-
110
-
111
-
112
-
113
-
114
-
115
-
116
-
117
-
118
-
119
-
120
-
121
-
122
-
123
-
124
-
125
-
126
-
127
-
128
-
129
-
130
-
131
-
132
-
133
-
134
-
135
-
136
 |
 |

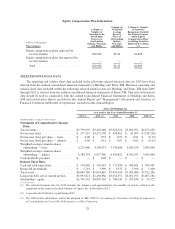
Equity Compensation Plan Information
(shares in thousands)
Plan Category
Column (a)
Number of
Securities to be
Issued upon
Exercise of
Outstanding
Options, Warrants
and Rights
Column (b)
Weighted-
Average
Exercise
Price of
Outstanding
Options,
Warrants
and Rights
Column (c) Number
of Securities
Remaining Available
for Future Issuance
under Equity
Compensation Plans
(excluding Securities
Reflected in Column
(a))
Equity compensation plans approved by
security holders ....................... 282,694 $2.43 82,806
Equity compensation plans not approved by
security holders ....................... — — —
Total ................................ 282,694 $2.43 82,806
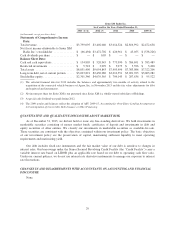
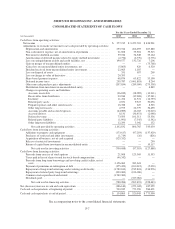
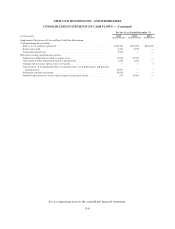
SELECTED FINANCIAL DATA
The operating and balance sheet data included in the following selected financial data for 2013 have been
derived from the audited consolidated financial statements of Holdings and Sirius XM. Historical operating and
balance sheet data included within the following selected financial data for Holdings and Sirius XM from 2009
through 2012 is derived from the audited consolidated financial statements of Sirius XM. This selected financial
data should be read in conjunction with the audited Consolidated Financial Statements of Holdings and Sirius
XM and related notes thereto included in this Annual Report and “Management’s Discussion and Analysis of
Financial Condition and Results of Operations” included in this Annual Report.
Sirius XM Holdings Inc.
As of and for the Years Ended December 31,
2013 (1) 2012 (2) 2011 2010 2009 (3)
(in thousands, except per share data)
Statements of Comprehensive Income
Data:
Total revenue ......................... $3,799,095 $3,402,040 $3,014,524 $2,816,992 $2,472,638
Net income (loss) ..................... $ 377,215 $3,472,702 $ 426,961 $ 43,055 $ (538,226)
Net income (loss) per share — basic ....... $ 0.06 $ 0.55 $ 0.07 $ 0.01 $ (0.15)
Net income (loss) per share — diluted ..... $ 0.06 $ 0.51 $ 0.07 $ 0.01 $ (0.15)
Weighted average common shares
outstanding — basic ................. 6,227,646 4,209,073 3,744,606 3,693,259 3,585,864
Weighted average common shares
outstanding — diluted ................ 6,384,791 6,873,786 6,500,822 6,391,071 3,585,864
Cash dividends per share ................ $ — $ 0.05 $ — $ — $ —
Balance Sheet Data:
Cash and cash equivalents ............... $ 134,805 $ 520,945 $ 773,990 $ 586,691 $ 383,489
Restricted investments ................. $ 5,718 $ 3,999 $ 3,973 $ 3,396 $ 3,400
Total assets .......................... $8,844,780 $9,054,843 $7,495,996 $7,383,086 $7,322,206
Long-term debt, net of current portion ..... $3,093,821 $2,430,986 $3,012,351 $3,021,763 $3,063,281
Stockholders’ equity ................... $2,745,742 $4,039,565 $ 704,145 $ 207,636 $ 95,522
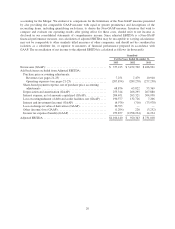
(1) The selected financial data for 2013 includes the balances and approximately two months of activity related to the
acquisition of the connected vehicle business of Agero, Inc. in November 2013.
(2) A special cash dividend was paid during 2012.
(3) The 2009 results and balances reflect the adoption of ASU 2009-15, Accounting for Own-Share Lending Arrangements
in Contemplation of Convertible Debt Issuance or Other Financing.
28