XM Radio 2013 Annual Report Download - page 86
Download and view the complete annual report
Please find page 86 of the 2013 XM Radio annual report below. You can navigate through the pages in the report by either clicking on the pages listed below, or by using the keyword search tool below to find specific information within the annual report.-
 1
1 -
2
-
3
-
4
-
5
-
6
-
7
-
8
-
9
-
10
-
11
-
12
-
13
-
14
-
15
-
16
-
17
-
18
-
19
-
20
-
21
-
22
-
23
-
24
-
25
-
26
-
27
-
28
-
29
-
30
-
31
-
32
-
33
-
34
-
35
-
36
-
37
-
38
-
39
-
40
-
41
-
42
-
43
-
44
-
45
-
46
-
47
-
48
-
49
-
50
-
51
-
52
-
53
-
54
-
55
-
56
-
57
-
58
-
59
-
60
-
61
-
62
-
63
-
64
-
65
-
66
-
67
-
68
-
69
-
70
-
71
-
72
-
73
-
74
-
75
-
 76
76 -
 77
77 -
 78
78 -
 79
79 -
 80
80 -
 81
81 -
 82
82 -
 83
83 -
 84
84 -
 85
85 -
 86
86 -
 87
87 -
 88
88 -
 89
89 -
 90
90 -
 91
91 -
 92
92 -
 93
93 -
 94
94 -
 95
95 -
 96
96 -
97
-
98
-
99
-
100
-
101
-
102
-
103
-
104
-
105
-
106
-
107
-
108
-
109
-
110
-
111
-
112
-
113
-
114
-
115
-
116
-
117
-
118
-
119
-
120
-
121
-
122
-
123
-
124
-
125
-
126
-
127
-
128
-
129
-
130
-
131
-
132
-
133
-
134
-
135
-
136
 |
 |

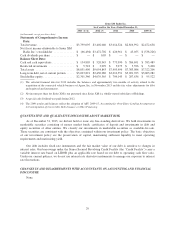
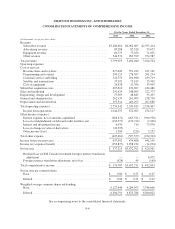
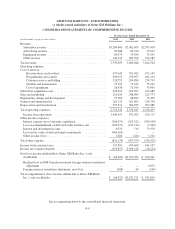
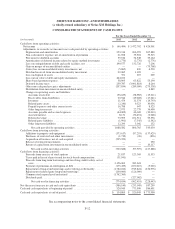
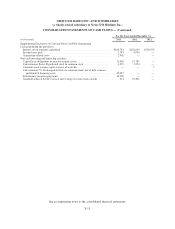
SIRIUS XM HOLDINGS INC. AND SUBSIDIARIES
CONSOLIDATED STATEMENTS OF COMPREHENSIVE INCOME
For the Years Ended December 31,
2013 2012 2011
(in thousands, except per share data)
Revenue:
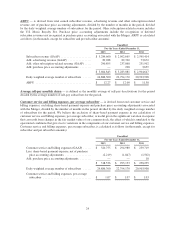
Subscriber revenue ........................................ $3,284,660 $2,962,665 $2,595,414
Advertising revenue ....................................... 89,288 82,320 73,672
Equipment revenue ........................................ 80,573 73,456 71,051
Other revenue ............................................ 344,574 283,599 274,387
Total revenue ............................................... 3,799,095 3,402,040 3,014,524
Operating expenses:
Cost of services:
Revenue share and royalties ................................. 677,642 551,012 471,149
Programming and content ................................... 290,323 278,997 281,234
Customer service and billing ................................. 320,755 294,980 259,719
Satellite and transmission ................................... 79,292 72,615 75,902
Cost of equipment ......................................... 26,478 31,766 33,095
Subscriber acquisition costs ................................... 495,610 474,697 434,482
Sales and marketing ......................................... 291,024 248,905 222,773
Engineering, design and development ........................... 57,969 48,843 53,435
General and administrative .................................... 262,135 261,905 238,738
Depreciation and amortization ................................. 253,314 266,295 267,880
Total operating expenses ...................................... 2,754,542 2,530,015 2,338,407
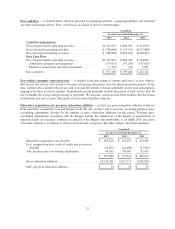
Income from operations .................................... 1,044,553 872,025 676,117
Other income (expense):
Interest expense, net of amounts capitalized ..................... (204,671) (265,321) (304,938)
Loss on extinguishment of debt and credit facilities, net ........... (190,577) (132,726) (7,206)
Interest and investment income ............................... 6,976 716 73,970
Loss on change in value of derivatives ......................... (20,393) — —
Other income (loss) ........................................ 1,204 (226) 3,252
Total other expense .......................................... (407,461) (397,557) (234,922)
Income before income taxes ................................... 637,092 474,468 441,195
Income tax (expense) benefit .................................. (259,877) 2,998,234 (14,234)
Net income ................................................ $ 377,215 $3,472,702 $ 426,961
Realized loss on XM Canada investment foreign currency translation
adjustment ............................................. — — 6,072
Foreign currency translation adjustment, net of tax ............... (428) 49 (140)
Total comprehensive income .................................. $ 376,787 $3,472,751 $ 432,893
Net income per common share:
Basic ................................................... $ 0.06 $ 0.55 $ 0.07
Diluted .................................................. $ 0.06 $ 0.51 $ 0.07
Weighted average common shares outstanding:
Basic ................................................... 6,227,646 4,209,073 3,744,606
Diluted .................................................. 6,384,791 6,873,786 6,500,822
See accompanying notes to the consolidated financial statements.
F-4