XM Radio 2013 Annual Report Download - page 66
Download and view the complete annual report
Please find page 66 of the 2013 XM Radio annual report below. You can navigate through the pages in the report by either clicking on the pages listed below, or by using the keyword search tool below to find specific information within the annual report.-
 1
1 -
2
-
3
-
4
-
5
-
6
-
7
-
8
-
9
-
10
-
11
-
12
-
13
-
14
-
15
-
16
-
17
-
18
-
19
-
20
-
21
-
22
-
23
-
24
-
25
-
26
-
27
-
28
-
29
-
30
-
31
-
32
-
33
-
34
-
35
-
36
-
37
-
38
-
39
-
40
-
41
-
42
-
43
-
44
-
45
-
46
-
47
-
48
-
49
-
50
-
51
-
52
-
53
-
54
-
55
-
 56
56 -
 57
57 -
 58
58 -
 59
59 -
 60
60 -
 61
61 -
 62
62 -
 63
63 -
 64
64 -
 65
65 -
 66
66 -
 67
67 -
 68
68 -
 69
69 -
 70
70 -
 71
71 -
 72
72 -
 73
73 -
 74
74 -
 75
75 -
 76
76 -
77
-
78
-
79
-
80
-
81
-
82
-
83
-
84
-
85
-
86
-
87
-
88
-
89
-
90
-
91
-
92
-
93
-
94
-
95
-
96
-
97
-
98
-
99
-
100
-
101
-
102
-
103
-
104
-
105
-
106
-
107
-
108
-
109
-
110
-
111
-
112
-
113
-
114
-
115
-
116
-
117
-
118
-
119
-
120
-
121
-
122
-
123
-
124
-
125
-
126
-
127
-
128
-
129
-
130
-
131
-
132
-
133
-
134
-
135
-
136
 |
 |
•2012 vs. 2011: For the years ended December 31, 2012 and 2011, SAC, per gross subscriber addition,
was $54 and $55, respectively. The decrease was primarily due to improved OEM subsidy rates per
vehicle, partially offset by higher subsidies related to increased OEM installations occurring in advance
of acquiring a subscriber.
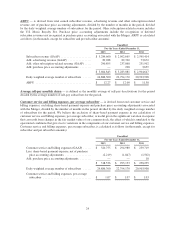
Customer Service and Billing Expenses, Per Average Subscriber, is derived from total customer service and
billing expenses, excluding share-based payment expense, divided by the number of months in the period,
divided by the daily weighted average number of subscribers for the period. (For a reconciliation to GAAP see
the accompanying glossary on pages 19 through 25 for more details.)
•2013 vs. 2012: For the years ended December 31, 2013 and 2012, customer service and billing
expenses, per average subscriber, were $1.07.
•2012 vs. 2011: For the years ended December 31, 2012 and 2011, customer service and billing
expenses, per average subscriber, were $1.07 and $1.03, respectively. The increase was primarily due to
longer average handle time per call and higher technology costs.
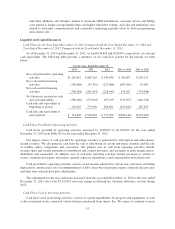
Free Cash Flow includes the net cash provided by operations, additions to property and equipment, and
restricted and other investment activity. (For a reconciliation to GAAP see the accompanying glossary on pages
19 through 25 for more details.)
•2013 vs. 2012: For the years ended December 31, 2013 and 2012, free cash flow was $927,496 and
$709,446, respectively, an increase of $218,050. The increase was primarily driven by higher net cash
provided by operating activities from improved operating performance, lower interest payments, and
higher collections from subscribers and distributors, partially offset by payments related to the launch of
our FM-6 satellite and the purchase of certain long-lead parts for a future satellite.
•2012 vs. 2011: For the years ended December 31, 2012 and 2011, free cash flow was $709,446 and
$415,742, respectively, an increase of $293,704. The increase was primarily driven by higher net cash
provided by operating activities from improved operating performance and higher collections from
subscribers and distributors, as well as a decrease in capital expenditures resulting from lower satellite
and related launch vehicle construction costs.
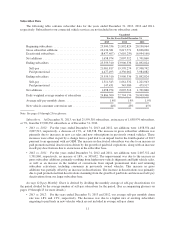
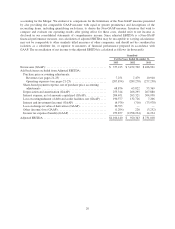
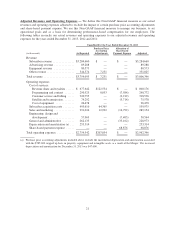
Adjusted EBITDA. EBITDA is defined as net income before interest and investment income (loss); interest
expense, net of amounts capitalized; income tax benefit (expense) and depreciation and amortization. Adjusted
EBITDA removes the impact of other income and expense, losses on extinguishment of debt, loss on change in
value of derivatives as well as certain other charges, such as goodwill impairment, certain purchase price
accounting adjustments and share-based payment expense. (For a reconciliation to GAAP see the accompanying
glossary on pages 19 through 25 for more details.)
•2013 vs. 2012: For the years ended December 31, 2013 and 2012, adjusted EBITDA was $1,166,140
and $920,343, respectively, an increase of 27%, or $245,797. The increase was primarily due to increases
in adjusted revenues, partially offset by increases in expenses included in adjusted EBITDA. The increase
in adjusted revenues was primarily due to the increase in our subscriber base and certain of our
subscription rates. The increase in expenses was primarily driven by higher revenue share and royalties
expenses associated with growth in revenues, sales and marketing costs related to subscriber
communications and retention marketing, customer service and billing costs related to increased agent
training and staffing as well as subscriber volume and subscriber acquisition costs.
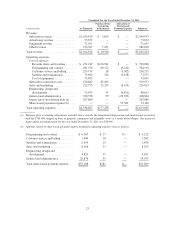
•2012 vs. 2011: For the years ended December 31, 2012 and 2011, adjusted EBITDA was $920,343 and
$731,018, respectively, an increase of 26%, or $189,325. The increase was primarily due to increases in
adjusted revenues, partially offset by increases in expenses included in adjusted EBITDA. The increase in
adjusted revenues was primarily due to the increase in our subscriber base and in certain of our
subscription rates. The increase in expenses was primarily driven by higher revenue share and royalties
expenses associated with growth in revenues, subscriber acquisition costs related to increased gross
14