XM Radio 2013 Annual Report Download - page 58
Download and view the complete annual report
Please find page 58 of the 2013 XM Radio annual report below. You can navigate through the pages in the report by either clicking on the pages listed below, or by using the keyword search tool below to find specific information within the annual report.-
 1
1 -
2
-
3
-
4
-
5
-
6
-
7
-
8
-
9
-
10
-
11
-
12
-
13
-
14
-
15
-
16
-
17
-
18
-
19
-
20
-
21
-
22
-
23
-
24
-
25
-
26
-
27
-
28
-
29
-
30
-
31
-
32
-
33
-
34
-
35
-
36
-
37
-
38
-
39
-
40
-
41
-
42
-
43
-
44
-
45
-
46
-
47
-
 48
48 -
 49
49 -
 50
50 -
 51
51 -
 52
52 -
 53
53 -
 54
54 -
 55
55 -
 56
56 -
 57
57 -
 58
58 -
 59
59 -
 60
60 -
 61
61 -
 62
62 -
 63
63 -
 64
64 -
 65
65 -
 66
66 -
 67
67 -
 68
68 -
69
-
70
-
71
-
72
-
73
-
74
-
75
-
76
-
77
-
78
-
79
-
80
-
81
-
82
-
83
-
84
-
85
-
86
-
87
-
88
-
89
-
90
-
91
-
92
-
93
-
94
-
95
-
96
-
97
-
98
-
99
-
100
-
101
-
102
-
103
-
104
-
105
-
106
-
107
-
108
-
109
-
110
-
111
-
112
-
113
-
114
-
115
-
116
-
117
-
118
-
119
-
120
-
121
-
122
-
123
-
124
-
125
-
126
-
127
-
128
-
129
-
130
-
131
-
132
-
133
-
134
-
135
-
136
 |
 |
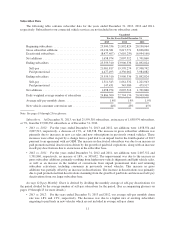
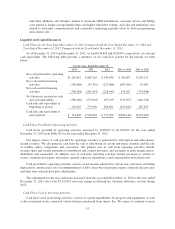
of total revenue. The increase was primarily due to reductions in the benefit to earnings from purchase
price accounting adjustments associated with the Merger attributable to the amortization of the deferred
credit on acquired programming executory contracts and increased personnel costs.
•2012 vs. 2011: For the years ended December 31, 2012 and 2011, programming and content expenses
were $278,997 and $281,234, respectively, a decrease of 1%, or $2,237, and decreased as a percentage of
total revenue. The decrease was primarily due to savings in content agreements, partially offset by
increases in personnel costs and reductions in the benefit to earnings from purchase price accounting
adjustments associated with the Merger attributable to the amortization of the deferred credit on acquired
programming executory contracts.
Excluding the impact from purchase accounting adjustments, based on our current programming offerings,
we expect our programming and content expenses to fluctuate as we offer additional programming, and renew or
replace expiring agreements. The impact of purchase price accounting adjustments associated with the Merger
attributable to the amortization of the deferred credit on acquired programming executory contracts will continue
to decline, in absolute amount and as a percentage of reported programming and content costs, through 2015.
Substantially all of the deferred credits on executory contracts were amortized by the end of 2013.
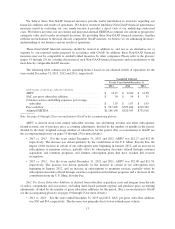
Customer Service and Billing includes costs associated with the operation and management of internal and
third party customer service centers, and our subscriber management systems as well as billing and collection
costs, transaction fees and bad debt expense.
•2013 vs. 2012: For the years ended December 31, 2013 and 2012, customer service and billing expenses
were $320,755 and $294,980, respectively, an increase of 9%, or $25,775, but remained flat as a
percentage of total revenue. The increase was primarily due to efforts to improve our customer service
experience, resulting in higher spend on customer service agents, staffing and training, higher subscriber
volume driving increased subscriber contacts, increased bad debt expense and higher technology costs.
•2012 vs. 2011: For the years ended December 31, 2012 and 2011, customer service and billing expenses
were $294,980 and $259,719, respectively, an increase of 14%, or $35,261, but remained flat as a
percentage of total revenue. The increase was primarily due to longer average handle time per call and
higher subscriber volume driving increased subscriber contacts and higher technology costs.
We expect our customer service and billing expenses to increase as our subscriber base grows and as we
attempt to improve the customer service experience for our subscribers.
Satellite and Transmission consists of costs associated with the operation and maintenance of our satellites;
satellite telemetry, tracking and control systems; terrestrial repeater networks; satellite uplink facilities; broadcast
studios; and delivery of our Internet streaming service.
•2013 vs. 2012: For the years ended December 31, 2013 and 2012, satellite and transmission expenses
were $79,292 and $72,615, respectively, an increase of 9%, or $6,677, but remained flat as a percentage
of total revenue. The increase was primarily due to increased costs associated with our Internet streaming
operations.
•2012 vs. 2011: For the years ended December 31, 2012 and 2011, satellite and transmission expenses
were $72,615 and $75,902, respectively, a decrease of 4%, or $3,287, and decreased as a percentage of
total revenue. The decrease was primarily due to a reduction of satellite in-orbit insurance expense as we
elected not to renew insurance policies on certain satellites.
We expect overall satellite and transmission expenses to increase as we enhance our Internet-based service
and add functionality, expand our terrestrial repeater network, and incur in-orbit insurance costs.
6