XM Radio 2013 Annual Report Download - page 55
Download and view the complete annual report
Please find page 55 of the 2013 XM Radio annual report below. You can navigate through the pages in the report by either clicking on the pages listed below, or by using the keyword search tool below to find specific information within the annual report.-
 1
1 -
2
-
3
-
4
-
5
-
6
-
7
-
8
-
9
-
10
-
11
-
12
-
13
-
14
-
15
-
16
-
17
-
18
-
19
-
20
-
21
-
22
-
23
-
24
-
25
-
26
-
27
-
28
-
29
-
30
-
31
-
32
-
33
-
34
-
35
-
36
-
37
-
38
-
39
-
40
-
41
-
42
-
43
-
44
-
 45
45 -
 46
46 -
 47
47 -
 48
48 -
 49
49 -
 50
50 -
 51
51 -
 52
52 -
 53
53 -
 54
54 -
 55
55 -
 56
56 -
 57
57 -
 58
58 -
 59
59 -
 60
60 -
 61
61 -
 62
62 -
 63
63 -
 64
64 -
 65
65 -
66
-
67
-
68
-
69
-
70
-
71
-
72
-
73
-
74
-
75
-
76
-
77
-
78
-
79
-
80
-
81
-
82
-
83
-
84
-
85
-
86
-
87
-
88
-
89
-
90
-
91
-
92
-
93
-
94
-
95
-
96
-
97
-
98
-
99
-
100
-
101
-
102
-
103
-
104
-
105
-
106
-
107
-
108
-
109
-
110
-
111
-
112
-
113
-
114
-
115
-
116
-
117
-
118
-
119
-
120
-
121
-
122
-
123
-
124
-
125
-
126
-
127
-
128
-
129
-
130
-
131
-
132
-
133
-
134
-
135
-
136
 |
 |

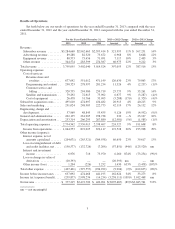
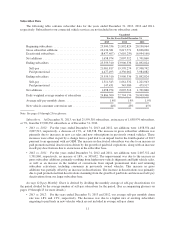
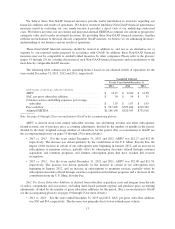
Results of Operations
Set forth below are our results of operations for the year ended December 31, 2013 compared with the year
ended December 31, 2012 and the year ended December 31, 2012 compared with the year ended December 31,
2011.
For the Years Ended December 31, 2013 vs 2012 Change 2012 vs 2011 Change
2013 2012 2011 Amount % Amount %
Revenue:
Subscriber revenue .........$3,284,660 $2,962,665 $2,595,414 $ 321,995 11% $ 367,251 14%
Advertising revenue ......... 89,288 82,320 73,672 6,968 8% 8,648 12%
Equipment revenue ......... 80,573 73,456 71,051 7,117 10% 2,405 3%
Other revenue ............. 344,574 283,599 274,387 60,975 22% 9,212 3%
Total revenue ................ 3,799,095 3,402,040 3,014,524 397,055 12% 387,516 13%
Operating expenses:
Cost of services:
Revenue share and
royalties .............. 677,642 551,012 471,149 126,630 23% 79,863 17%
Programming and content . . 290,323 278,997 281,234 11,326 4% (2,237) (1)%
Customer service and
billing ................ 320,755 294,980 259,719 25,775 9% 35,261 14%
Satellite and transmission . . 79,292 72,615 75,902 6,677 9% (3,287) (4)%
Cost of equipment ........ 26,478 31,766 33,095 (5,288) (17)% (1,329) (4)%
Subscriber acquisition costs ..... 495,610 474,697 434,482 20,913 4% 40,215 9%
Sales and marketing ........... 291,024 248,905 222,773 42,119 17% 26,132 12%
Engineering, design and
development ............... 57,969 48,843 53,435 9,126 19% (4,592) (9)%
General and administrative ..... 262,135 261,905 238,738 230 —% 23,167 10%
Depreciation and amortization . . . 253,314 266,295 267,880 (12,981) (5)% (1,585) (1)%
Total operating expenses ....... 2,754,542 2,530,015 2,338,407 224,527 9% 191,608 8%
Income from operations ...... 1,044,553 872,025 676,117 172,528 20% 195,908 29%
Other income (expense):
Interest expense, net of
amounts capitalized ....... (204,671) (265,321) (304,938) 60,650 23% 39,617 13%
Loss on extinguishment of debt
and credit facilities, net .... (190,577) (132,726) (7,206) (57,851) (44)% (125,520) nm
Interest and investment
income ................. 6,976 716 73,970 6,260 874% (73,254) (99)%
Loss on change in value of
derivatives .............. (20,393) — — (20,393) nm — nm
Other income (loss) ......... 1,204 (226) 3,252 1,430 633% (3,478) (107)%
Total other expense ........... (407,461) (397,557) (234,922) (9,904) (2)% (162,635) (69)%
Income before income taxes .... 637,092 474,468 441,195 162,624 34% 33,273 8%
Income tax (expense) benefit .... (259,877) 2,998,234 (14,234) (3,258,111) (109)% 3,012,468 nm
Net income ..................$ 377,215 $3,472,702 $ 426,961 $(3,095,487) (89)%$3,045,741 713%
nm — not meaningful
3