XM Radio 2013 Annual Report Download - page 67
Download and view the complete annual report
Please find page 67 of the 2013 XM Radio annual report below. You can navigate through the pages in the report by either clicking on the pages listed below, or by using the keyword search tool below to find specific information within the annual report.-
 1
1 -
2
-
3
-
4
-
5
-
6
-
7
-
8
-
9
-
10
-
11
-
12
-
13
-
14
-
15
-
16
-
17
-
18
-
19
-
20
-
21
-
22
-
23
-
24
-
25
-
26
-
27
-
28
-
29
-
30
-
31
-
32
-
33
-
34
-
35
-
36
-
37
-
38
-
39
-
40
-
41
-
42
-
43
-
44
-
45
-
46
-
47
-
48
-
49
-
50
-
51
-
52
-
53
-
54
-
55
-
56
-
 57
57 -
 58
58 -
 59
59 -
 60
60 -
 61
61 -
 62
62 -
 63
63 -
 64
64 -
 65
65 -
 66
66 -
 67
67 -
 68
68 -
 69
69 -
 70
70 -
 71
71 -
 72
72 -
 73
73 -
 74
74 -
 75
75 -
 76
76 -
 77
77 -
78
-
79
-
80
-
81
-
82
-
83
-
84
-
85
-
86
-
87
-
88
-
89
-
90
-
91
-
92
-
93
-
94
-
95
-
96
-
97
-
98
-
99
-
100
-
101
-
102
-
103
-
104
-
105
-
106
-
107
-
108
-
109
-
110
-
111
-
112
-
113
-
114
-
115
-
116
-
117
-
118
-
119
-
120
-
121
-
122
-
123
-
124
-
125
-
126
-
127
-
128
-
129
-
130
-
131
-
132
-
133
-
134
-
135
-
136
 |
 |

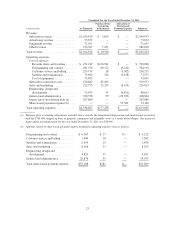
subscriber additions and subsidies related to increased OEM installations, customer service and billing
costs related to longer average handle times and higher subscriber volume, and sales and marketing costs
related to subscriber communications and cooperative marketing, partially offset by lower programming
and content costs.
Liquidity and Capital Resources
Cash Flows for the Year Ended December 31, 2013 Compared with the Year Ended December 31, 2012 and
Year Ended December 31, 2012 Compared with the Year Ended December 31, 2011.
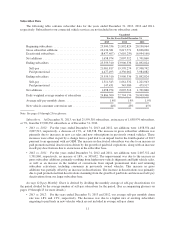
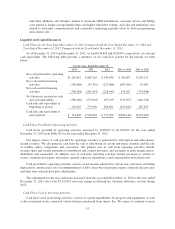
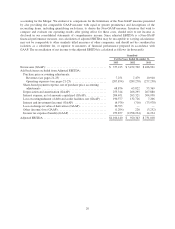
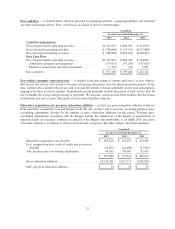
As of December 31, 2013 and December 31, 2012, we had $134,805 and $520,945, respectively, of cash and
cash equivalents. The following table presents a summary of our cash flow activity for the periods set forth
below:
For the Years Ended December 31,
2013 2012 2011 2013 vs. 2012 2012 vs. 2011
Net cash provided by operating
activities ................ $1,102,832 $ 806,765 $ 543,630 $ 296,067 $ 263,135
Net cash used in investing
activities ................ (700,688) (97,319) (127,888) (603,369) 30,569
Net cash used in financing
activities ................ (788,284) (962,491) (228,443) 174,207 (734,048)
Net (decrease) increase in cash
and cash equivalents ....... (386,140) (253,045) 187,299 (133,095) (440,344)
Cash and cash equivalents at
beginning of period ....... 520,945 773,990 586,691 (253,045) 187,299
Cash and cash equivalents at
end of period ............ $ 134,805 $ 520,945 $ 773,990 $(386,140) $(253,045)
Cash Flows Provided by Operating Activities
Cash flows provided by operating activities increased by $296,067 to $1,102,832 for the year ended
December 31, 2013 from $806,765 for the year ended December 31, 2012.
Our largest source of cash provided by operating activities is generated by subscription and subscription-
related revenues. We also generate cash from the sale of advertising on certain non-music channels and the sale
of satellite radios, components and accessories. Our primary uses of cash from operating activities include
revenue share and royalty payments to distributors and content providers, and payments to radio manufacturers,
distributors and automakers. In addition, uses of cash from operating activities include payments to vendors to
service, maintain and acquire subscribers, general corporate expenditures, and compensation and related costs.
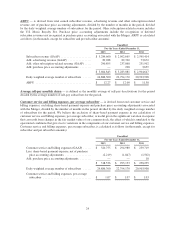
Cash provided by operating activities consists of net income adjusted for certain non-cash items, including
depreciation, amortization, loss on extinguishment of debt, share-based payment expense, deferred income taxes
and other non-cash purchase price adjustments.
The adjustments for the non-cash items increased from the year ended December 31, 2012 to the year ended
December 31, 2013 due to the $3,195,651 non-cash change in deferred tax valuation allowance reversal during
2012.
Cash Flows Used in Investing Activities
Cash flows used in investing activities consists of capital expenditures for property and equipment, as well
as the investment in the connected vehicle business purchased from Agero, Inc. We expect to continue to incur
15