Seagate 2007 Annual Report Download - page 94
Download and view the complete annual report
Please find page 94 of the 2007 Seagate annual report below. You can navigate through the pages in the report by either clicking on the pages listed below, or by using the keyword search tool below to find specific information within the annual report.-
 1
1 -
2
-
3
-
4
-
5
-
6
-
7
-
8
-
9
-
10
-
11
-
12
-
13
-
14
-
15
-
16
-
17
-
18
-
19
-
20
-
21
-
22
-
23
-
24
-
25
-
26
-
27
-
28
-
29
-
30
-
31
-
32
-
33
-
34
-
35
-
36
-
37
-
38
-
39
-
40
-
41
-
42
-
43
-
44
-
45
-
46
-
47
-
48
-
49
-
50
-
51
-
52
-
53
-
54
-
55
-
56
-
57
-
58
-
59
-
60
-
61
-
62
-
63
-
64
-
65
-
66
-
67
-
68
-
69
-
70
-
71
-
72
-
73
-
74
-
75
-
76
-
77
-
78
-
79
-
80
-
81
-
82
-
83
-
 84
84 -
 85
85 -
 86
86 -
 87
87 -
 88
88 -
 89
89 -
 90
90 -
 91
91 -
 92
92 -
 93
93 -
 94
94 -
 95
95 -
 96
96 -
 97
97 -
 98
98 -
 99
99 -
 100
100 -
 101
101 -
 102
102 -
 103
103 -
 104
104 -
105
-
106
-
107
-
108
-
109
-
110
-
111
-
112
-
113
-
114
-
115
-
116
-
117
-
118
-
119
-
120
-
121
-
122
-
123
-
124
-
125
-
126
-
127
-
128
-
129
-
130
-
131
-
132
-
133
-
134
-
135
-
136
-
137
-
138
-
139
-
140
-
141
-
142
-
143
-
144
-
145
-
146
-
147
-
148
-
149
-
150
-
151
-
152
-
153
-
154
-
155
-
156
-
157
-
158
-
159
-
160
-
161
-
162
-
163
-
164
-
165
-
166
-
167
-
168
-
169
-
170
-
171
-
172
-
173
-
174
-
175
-
176
-
177
-
178
-
179
-
180
-
181
-
182
-
183
-
184
-
185
-
186
-
187
-
188
-
189
-
190
-
191
-
192
-
193
-
194
-
195
-
196
-
197
-
198
-
199
-
200
-
201
-
202
-
203
 |
 |

Table of Contents
SEAGATE TECHNOLOGY
NOTES TO CONSOLIDATED FINANCIAL STATEMENTS
—
(
Continued)
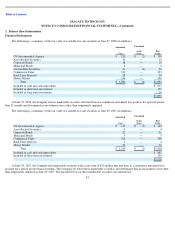
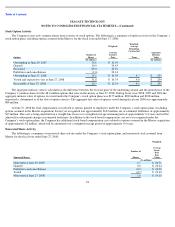
Fair Value —The fair value of the Company’s stock options granted to employees, assumed from Maxtor and issued from the ESPP for
fiscal years 2008, 2007 and 2006 were estimated using the following weighted-average assumptions:
Stock Compensation Expense
Fiscal Years Ended
2008
2007
2006
Options under Seagate Plans
Expected term (in years)
4.0
4.0
3.5
–
4.0
Volatility
35
–
36%
37
–
39%
40
–
43%
Expected dividend
1.5
–
2.5%
1.3
–
1.9%
1.2
–
2.3%
Risk
-
free interest rate
2.3
–
4.2%
4.4
–
4.8%
4.1
–
5.0%
Estimated annual forfeitures
4.5%
4.5%
4.6
–
4.9%
Weighted
-
average fair value
$7.31
$7.41
$7.15
Options under Maxtor Plans
Expected term (in years)
—
—
0
–
4.8
Volatility
—
—
36
–
39%
Expected dividend
—
—
1.3%
Risk
-
free interest rate
—
—
5.0
–
5.1%
Weighted
-
average fair value
—
—
$
10.49
ESPP
Expected term (in years)
0.5
0.5
0.5
–
1.0
Volatility
31
–
36%
33
–
34%
37
–
41%
Expected dividend
1.7
–
2.3%
1.4
–
1.5%
1.2
–
1.7%
Risk
-
free interest rate
2.0
–
5.0%
5.0
–
5.2%
3.6
–
4.5%
Weighted
-
average fair value
$4.67
$5.80
$7.28
Stock Compensation Expense
—
The Company recorded $98 million, $101 million and $74 million of stock
-
based compensation during
fiscal years 2008, 2007 and 2006, respectively. Additionally, the Company recorded $15 million, $27 million and $16 million of stock-based
compensation in fiscal years 2008, 2007 and 2006, respectively, in connection with the assumed options and nonvested shares exchanged in the
Maxtor acquisition (see Note 10).
As required by SFAS No. 123(R), management made an estimate of expected forfeitures and is recognizing compensation costs only for
those equity awards expected to vest.
In accordance with guidance in SFAS No. 123(R), the cash flows resulting from excess tax benefits (tax benefits related to the excess of
proceeds from employee’s exercises of stock options over the stock-based compensation cost recognized for those options) are classified as
financing cash flows. The Company recorded approximately $6 million of excess tax benefits as a financing cash inflow during fiscal year 2008.
The Company did not recognize any cash flows from excess tax benefits during fiscal year 2007. The Company recorded approximately
$44 million of excess tax benefits as a financing cash inflow during fiscal year 2006.
93