Seagate 2007 Annual Report Download - page 50
Download and view the complete annual report
Please find page 50 of the 2007 Seagate annual report below. You can navigate through the pages in the report by either clicking on the pages listed below, or by using the keyword search tool below to find specific information within the annual report.-
 1
1 -
2
-
3
-
4
-
5
-
6
-
7
-
8
-
9
-
10
-
11
-
12
-
13
-
14
-
15
-
16
-
17
-
18
-
19
-
20
-
21
-
22
-
23
-
24
-
25
-
26
-
27
-
28
-
29
-
30
-
31
-
32
-
33
-
34
-
35
-
36
-
37
-
38
-
39
-
 40
40 -
 41
41 -
 42
42 -
 43
43 -
 44
44 -
 45
45 -
 46
46 -
 47
47 -
 48
48 -
 49
49 -
 50
50 -
 51
51 -
 52
52 -
 53
53 -
 54
54 -
 55
55 -
 56
56 -
 57
57 -
 58
58 -
 59
59 -
 60
60 -
61
-
62
-
63
-
64
-
65
-
66
-
67
-
68
-
69
-
70
-
71
-
72
-
73
-
74
-
75
-
76
-
77
-
78
-
79
-
80
-
81
-
82
-
83
-
84
-
85
-
86
-
87
-
88
-
89
-
90
-
91
-
92
-
93
-
94
-
95
-
96
-
97
-
98
-
99
-
100
-
101
-
102
-
103
-
104
-
105
-
106
-
107
-
108
-
109
-
110
-
111
-
112
-
113
-
114
-
115
-
116
-
117
-
118
-
119
-
120
-
121
-
122
-
123
-
124
-
125
-
126
-
127
-
128
-
129
-
130
-
131
-
132
-
133
-
134
-
135
-
136
-
137
-
138
-
139
-
140
-
141
-
142
-
143
-
144
-
145
-
146
-
147
-
148
-
149
-
150
-
151
-
152
-
153
-
154
-
155
-
156
-
157
-
158
-
159
-
160
-
161
-
162
-
163
-
164
-
165
-
166
-
167
-
168
-
169
-
170
-
171
-
172
-
173
-
174
-
175
-
176
-
177
-
178
-
179
-
180
-
181
-
182
-
183
-
184
-
185
-
186
-
187
-
188
-
189
-
190
-
191
-
192
-
193
-
194
-
195
-
196
-
197
-
198
-
199
-
200
-
201
-
202
-
203
 |
 |

Table of Contents
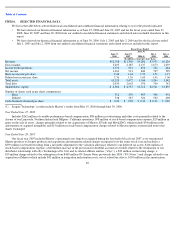
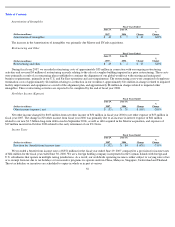
Results of Operations
We list in the tables below the historical consolidated statements of operations in dollars and as a percentage of revenue for the fiscal years
indicated.
Fiscal Year 2008 Compared to Fiscal Year 2007
Fiscal Years Ended
June 27,
2008
June 29,
2007
June 30,
2006
(In millions)
Revenue
$
12,708
$
11,360
$
9,206
Cost of revenue
9,503
9,175
7,069
Gross margin
3,205
2,185
2,137
Product development
1,028
904
805
Marketing and administrative
659
589
447
Amortization of intangibles
54
49
7
Restructuring and other
88
29
4
Income from operations
1,376
614
874
Other income (expense), net
(47
)
(53
)
50
Income before income taxes
1,329
561
924
Provision for (benefit from) income taxes
67
(352
)
84
Net income
$
1,262
$
913
$
840
Fiscal Years Ended
June 27,
2008
June 29,
2007
June 30,
2006
(as a percentage of Revenue)
Revenue
100
%
100
%
100
%
Cost of revenue
75
81
77
Gross margin
25
19
23
Product development
8
8
9
Marketing and administrative
5
5
5
Amortization of intangibles
—
1
—
Restructuring and other
1
—
—
Income from operations
11
5
9
Other income (expense), net
—
—
1
Income before income taxes
11
5
10
Provision for (benefit from) income taxes
1
(3
)
1
Net income
10
%
8
%
9
%
Revenue
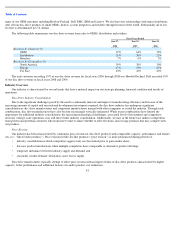
Revenue growth in fiscal year 2008 reflected a 15% growth in the number of disc drives shipped. We believe unit growth was driven by
continued growth in digital content, the resulting increase in demand for storage and customer acceptance of our new products. Industry disc
drive demand across all markets grew by
49
Fiscal Years Ended
(Dollars in millions)
June 27,
2008
June 29,
2007
Change
%
Change
Revenue
$
12,708
$
11,360
$
1,348
12
%