Seagate 2007 Annual Report Download - page 137
Download and view the complete annual report
Please find page 137 of the 2007 Seagate annual report below. You can navigate through the pages in the report by either clicking on the pages listed below, or by using the keyword search tool below to find specific information within the annual report.-
 1
1 -
2
-
3
-
4
-
5
-
6
-
7
-
8
-
9
-
10
-
11
-
12
-
13
-
14
-
15
-
16
-
17
-
18
-
19
-
20
-
21
-
22
-
23
-
24
-
25
-
26
-
27
-
28
-
29
-
30
-
31
-
32
-
33
-
34
-
35
-
36
-
37
-
38
-
39
-
40
-
41
-
42
-
43
-
44
-
45
-
46
-
47
-
48
-
49
-
50
-
51
-
52
-
53
-
54
-
55
-
56
-
57
-
58
-
59
-
60
-
61
-
62
-
63
-
64
-
65
-
66
-
67
-
68
-
69
-
70
-
71
-
72
-
73
-
74
-
75
-
76
-
77
-
78
-
79
-
80
-
81
-
82
-
83
-
84
-
85
-
86
-
87
-
88
-
89
-
90
-
91
-
92
-
93
-
94
-
95
-
96
-
97
-
98
-
99
-
100
-
101
-
102
-
103
-
104
-
105
-
106
-
107
-
108
-
109
-
110
-
111
-
112
-
113
-
114
-
115
-
116
-
117
-
118
-
119
-
120
-
121
-
122
-
123
-
124
-
125
-
126
-
 127
127 -
 128
128 -
 129
129 -
 130
130 -
 131
131 -
 132
132 -
 133
133 -
 134
134 -
 135
135 -
 136
136 -
 137
137 -
 138
138 -
 139
139 -
 140
140 -
 141
141 -
 142
142 -
 143
143 -
 144
144 -
 145
145 -
 146
146 -
 147
147 -
148
-
149
-
150
-
151
-
152
-
153
-
154
-
155
-
156
-
157
-
158
-
159
-
160
-
161
-
162
-
163
-
164
-
165
-
166
-
167
-
168
-
169
-
170
-
171
-
172
-
173
-
174
-
175
-
176
-
177
-
178
-
179
-
180
-
181
-
182
-
183
-
184
-
185
-
186
-
187
-
188
-
189
-
190
-
191
-
192
-
193
-
194
-
195
-
196
-
197
-
198
-
199
-
200
-
201
-
202
-
203
 |
 |

Table of Contents
SEAGATE TECHNOLOGY
NOTES TO CONSOLIDATED FINANCIAL STATEMENTS
—
(
Continued)
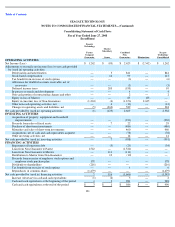
15. Supplementary Financial Data (Unaudited)
Quarterly Data
The Company operated and reported financial results based on 13 week quarters in fiscal 2008 and 2007, which ended on the Friday
closest to September 30, December 31, March 31, and June 30.
The results for the first quarter of fiscal year 2008 include approximately $69 million of variable performance-based compensation,
$29 million of stock-based compensation, $24 million in the amortization of intangibles primarily related to the Maxtor acquisition and $5
million in restructuring charges.
The results for the second quarter of fiscal year 2008 include approximately $77 million of variable performance-based compensation,
$29 million of stock-based compensation, $24 million in the amortization of intangibles primarily related to the Maxtor acquisition, $27 million
in restructuring charges primarily related to the closure of the Company’
s Limavady, Northern Ireland operations and $15 million of gains on the
sale of assets.
The results for the third quarter of fiscal year 2008 include approximately $71 million of variable performance-based compensation,
$28 million of stock-based compensation, $26 million in the amortization of intangibles primarily related to the Maxtor acquisition and
$20 million in restructuring and other charges primarily related to the closure of the Company’s Limavady, Northern Ireland operations.
The results for the fourth quarter of fiscal year 2008 include approximately $45 million of variable performance-based compensation,
$27 million of stock-based compensation, $20 million in the amortization of intangibles primarily related to the Maxtor acquisition and
$36 million in restructuring charges, primarily related to the closure of the Company’s Limavady, Northern Ireland and Milpitas, California
operations.
The results for the first quarter of fiscal year 2007 include a $40 million increase in the provision for doubtful accounts related to the
termination of the Company’s distributor relationship with eSys and its related affiliated entities, approximately $24 million of stock-based
compensation, Maxtor’s operating losses and related
136
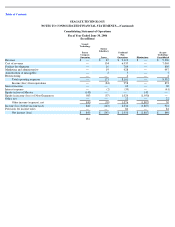
Fiscal Year 2008 Quarters Ended
(In millions, except per share data)
September 28,
2007
December 28,
2007
March 28,
2008
June 27,
2008
Revenue
$
3,285
$
3,420
$
3,104
$
2,899
Gross margin
809
889
816
691
Income from operations
396
420
363
197
Net income
355
403
344
160
Net income per share:
Basic
$
0.67
$
0.77
$
0.68
$
0.33
Diluted
0.64
0.73
0.65
0.32
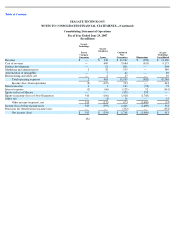
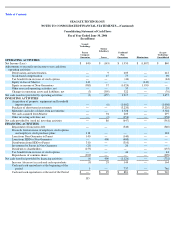
Fiscal Year 2007 Quarters Ended
(In millions, except per share data)
September 29,
2006
December 29,
2006
March 30,
2007
June 29,
2007
Revenue
$
2,793
$
2,996
$
2,828
$
2,744
Gross margin
442
546
603
594
Income from operations
12
166
247
188
Net income
19
140
212
541
Net income per share:
Basic
$
0.03
$
0.25
$
0.39
$
1.00
Diluted
0.03
0.23
0.37
0.96