Seagate 2007 Annual Report Download - page 61
Download and view the complete annual report
Please find page 61 of the 2007 Seagate annual report below. You can navigate through the pages in the report by either clicking on the pages listed below, or by using the keyword search tool below to find specific information within the annual report.-
 1
1 -
2
-
3
-
4
-
5
-
6
-
7
-
8
-
9
-
10
-
11
-
12
-
13
-
14
-
15
-
16
-
17
-
18
-
19
-
20
-
21
-
22
-
23
-
24
-
25
-
26
-
27
-
28
-
29
-
30
-
31
-
32
-
33
-
34
-
35
-
36
-
37
-
38
-
39
-
40
-
41
-
42
-
43
-
44
-
45
-
46
-
47
-
48
-
49
-
50
-
 51
51 -
 52
52 -
 53
53 -
 54
54 -
 55
55 -
 56
56 -
 57
57 -
 58
58 -
 59
59 -
 60
60 -
 61
61 -
 62
62 -
 63
63 -
 64
64 -
 65
65 -
 66
66 -
 67
67 -
 68
68 -
 69
69 -
 70
70 -
 71
71 -
72
-
73
-
74
-
75
-
76
-
77
-
78
-
79
-
80
-
81
-
82
-
83
-
84
-
85
-
86
-
87
-
88
-
89
-
90
-
91
-
92
-
93
-
94
-
95
-
96
-
97
-
98
-
99
-
100
-
101
-
102
-
103
-
104
-
105
-
106
-
107
-
108
-
109
-
110
-
111
-
112
-
113
-
114
-
115
-
116
-
117
-
118
-
119
-
120
-
121
-
122
-
123
-
124
-
125
-
126
-
127
-
128
-
129
-
130
-
131
-
132
-
133
-
134
-
135
-
136
-
137
-
138
-
139
-
140
-
141
-
142
-
143
-
144
-
145
-
146
-
147
-
148
-
149
-
150
-
151
-
152
-
153
-
154
-
155
-
156
-
157
-
158
-
159
-
160
-
161
-
162
-
163
-
164
-
165
-
166
-
167
-
168
-
169
-
170
-
171
-
172
-
173
-
174
-
175
-
176
-
177
-
178
-
179
-
180
-
181
-
182
-
183
-
184
-
185
-
186
-
187
-
188
-
189
-
190
-
191
-
192
-
193
-
194
-
195
-
196
-
197
-
198
-
199
-
200
-
201
-
202
-
203
 |
 |

Table of Contents
•
$
167 million for manufacturing facilities and equipment for our recording head operations in the United States, the Far East and
Northern Ireland;
•
$20 million for manufacturing facilities and equipment for alternative technologies in the United States; and
During fiscal year 2006, we used $561 million for net cash investing activities, which was primarily attributable to expenditures for
property, equipment and leasehold improvements partially offset by the maturities and sales of short-term investments in excess of purchases
thereof, as well as net cash acquired from Maxtor. Specifically, during fiscal year 2006, we invested approximately $1.0 billion in property,
equipment and leasehold improvements primarily comprised of:
•
$
113 million for research and development, information technology infrastructure and other facilities and equipment costs.
•
$
376 million for manufacturing facilities and equipment related to our subassembly and disc drive final assembly and test facilities in
the Far East;
•
$143 million to upgrade and expansion of our recording media operations in the United States, Singapore and Northern Ireland;
•
$
337 million for manufacturing facilities and equipment for our recording head operations in the United States, the Far East and
Northern Ireland;
•
$
10 million for manufacturing facilities and equipment for alternative technologies in the United States; and
During fiscal years 2006 through 2008, we increased capacity to support increased unit shipments and additional capacity for the ramp-up
and production of Seagate-designed disc drive products to replace legacy Maxtor-designed products and to continue with our planned media and
substrate capacity expansions in Asia. For fiscal year 2009, we expect approximately $1 billion in capital investment will be required to ensure
continued alignment of our manufacturing capacity with of customer demand and to finish our planned recording media and substrate capacity
expansions in Asia, while we continue to improve our utilization of capital equipment.
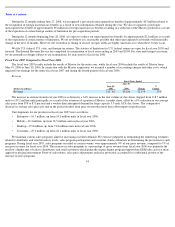
Cash Used in Financing Activities
•
$142 million for research and development, information technology infrastructure, as well as Maxtor and other facilities and
equipment costs.
Net cash used in financing activities of approximately $1.5 billion for fiscal year 2008 was primarily attributable to the repurchases of our
common shares totaling $1.5 billion. Additionally, we paid approximately $216 million in dividends to our shareholders, repaid $34 million of
our long-term debt and received approximately $178 million in cash from employee stock option exercises and employee stock purchases.
Net cash used in financing activities of $463 million for fiscal year 2007 was primarily attributable to approximately $1.5 billion used for
the repurchases of our common shares, $416 million used in the redemption of our 8% Notes and $212 million of dividends paid to our
shareholders, largely offset by approximately $1.5 billion received from the issuance of long-term debt and $219 million cash provided by
employee stock option exercises and employee stock purchases.
Net cash used in financing activities of $732 million for fiscal year 2006 was primarily attributable to $399 million used in the repurchases
of common shares, the repayment of a $340 million term loan and $155 million of dividends paid to our shareholders, partially offset by
$118 million cash provided by employee stock option exercises and employee stock purchases.
60