Seagate 2007 Annual Report Download - page 59
Download and view the complete annual report
Please find page 59 of the 2007 Seagate annual report below. You can navigate through the pages in the report by either clicking on the pages listed below, or by using the keyword search tool below to find specific information within the annual report.-
 1
1 -
2
-
3
-
4
-
5
-
6
-
7
-
8
-
9
-
10
-
11
-
12
-
13
-
14
-
15
-
16
-
17
-
18
-
19
-
20
-
21
-
22
-
23
-
24
-
25
-
26
-
27
-
28
-
29
-
30
-
31
-
32
-
33
-
34
-
35
-
36
-
37
-
38
-
39
-
40
-
41
-
42
-
43
-
44
-
45
-
46
-
47
-
48
-
 49
49 -
 50
50 -
 51
51 -
 52
52 -
 53
53 -
 54
54 -
 55
55 -
 56
56 -
 57
57 -
 58
58 -
 59
59 -
 60
60 -
 61
61 -
 62
62 -
 63
63 -
 64
64 -
 65
65 -
 66
66 -
 67
67 -
 68
68 -
 69
69 -
70
-
71
-
72
-
73
-
74
-
75
-
76
-
77
-
78
-
79
-
80
-
81
-
82
-
83
-
84
-
85
-
86
-
87
-
88
-
89
-
90
-
91
-
92
-
93
-
94
-
95
-
96
-
97
-
98
-
99
-
100
-
101
-
102
-
103
-
104
-
105
-
106
-
107
-
108
-
109
-
110
-
111
-
112
-
113
-
114
-
115
-
116
-
117
-
118
-
119
-
120
-
121
-
122
-
123
-
124
-
125
-
126
-
127
-
128
-
129
-
130
-
131
-
132
-
133
-
134
-
135
-
136
-
137
-
138
-
139
-
140
-
141
-
142
-
143
-
144
-
145
-
146
-
147
-
148
-
149
-
150
-
151
-
152
-
153
-
154
-
155
-
156
-
157
-
158
-
159
-
160
-
161
-
162
-
163
-
164
-
165
-
166
-
167
-
168
-
169
-
170
-
171
-
172
-
173
-
174
-
175
-
176
-
177
-
178
-
179
-
180
-
181
-
182
-
183
-
184
-
185
-
186
-
187
-
188
-
189
-
190
-
191
-
192
-
193
-
194
-
195
-
196
-
197
-
198
-
199
-
200
-
201
-
202
-
203
 |
 |
Table of Contents
In September 2006, Seagate Technology HDD Holdings (“HDD”), our wholly-owned direct subsidiary issued senior notes totaling
$1.5 billion comprised of $300 million aggregate principal amount of Floating Rate Senior Notes due October 2009 (the “2009 Notes”),
$600 million aggregate principal amount of 6.375% Senior Notes due October 2011 (the “2011 Notes”) and $600 million aggregate principal
amount of 6.800% Senior Notes due October 2016 (the “2016 Notes”). The notes are guaranteed by Seagate Technology on a full and
unconditional basis.
As of June 27, 2008, we held auction rate securities in the amount of $31 million, all of which are collateralized by pools of student loans
guaranteed by the Federal Family Education Loan Program. During the fiscal 2008 year, these securities failed to settle at auction and as a result
we recorded an unrealized loss of $3 million and reclassified the securities to long-term investments.
At June 27, 2008, our exposure to sub-prime mortgage securities was not significant. As of the date of this filing, we are not aware of any
downgrades, losses, or other significant deterioration in the fair value of our cash equivalents or short-term investments since June 27, 2008.
Until required for other purposes, our cash and cash equivalents are maintained in highly liquid investments with remaining maturities of
90 days or less at the time of purchase. Our short-term investments consist primarily of readily marketable debt securities with remaining
maturities of more than 90 days at the time of purchase. As stated in our investment policy, we are averse to principal loss and ensure the safety
and preservation of our invested funds by limiting default risk and market risk. We mitigate default risk by maintaining portfolio investments in
diversified, high-quality investment grade securities with limited time to maturity. We monitor our investment portfolio and position our
portfolio to respond appropriately to a reduction in credit rating of any investment issuer, guarantor or depository. We intend to maintain a
highly liquid portfolio by investing only in those marketable securities that we believe have active secondary or resale markets. We operate in
some countries that may have restrictive regulations over the movement of cash and/or foreign exchange across their borders. These restrictions
have not impeded our ability to conduct business in those countries, nor do we expect them to in the next 12 months.
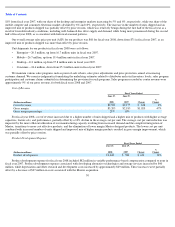
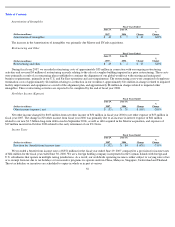
The following table summarizes results of statement of cash flows for the periods indicated:
Cash Provided by Operating Activities
Fiscal Years Ended
(Dollars in millions)
June 27,
2008
June 29,
2007
June 30,
2006
Net cash flow provided by (used in):
Operating Activities
$
2,538
$
943
$
1,457
Investing Activities
$
(991
)
$
(402
)
$
(561
)
Financing Activities
$
(1,545
)
$
(463
)
$
(732
)
Net increase in cash and cash equivalents
$
2
$
78
$
164
Cash provided by operating activities for fiscal year 2008 was approximately $2.5 billion and included the effects of:
•
net income adjusted for non
-
cash items including depreciation, amortization, and stock
-
based compensation;
•
an increase of $351 million in accounts payable, primarily as a result of outsourcing the manufacture of certain sub-assemblies to third
parties;
•
an increase of $238 million in vendor non
-
trade receivables, primarily as a result of outsourcing the manufacture of certain sub
-
assemblies to third parties (see Note 2 to the Notes to Consolidated Financial Statements);
•
an increase of $151 million in inventories, principally raw materials and finished goods; and
58
•
an increase of $154 million in accrued expenses, employee compensation and warranty.