Seagate 2007 Annual Report Download - page 51
Download and view the complete annual report
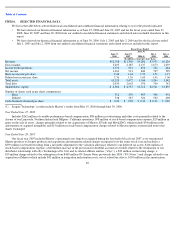
Please find page 51 of the 2007 Seagate annual report below. You can navigate through the pages in the report by either clicking on the pages listed below, or by using the keyword search tool below to find specific information within the annual report.-
 1
1 -
2
-
3
-
4
-
5
-
6
-
7
-
8
-
9
-
10
-
11
-
12
-
13
-
14
-
15
-
16
-
17
-
18
-
19
-
20
-
21
-
22
-
23
-
24
-
25
-
26
-
27
-
28
-
29
-
30
-
31
-
32
-
33
-
34
-
35
-
36
-
37
-
38
-
39
-
40
-
 41
41 -
 42
42 -
 43
43 -
 44
44 -
 45
45 -
 46
46 -
 47
47 -
 48
48 -
 49
49 -
 50
50 -
 51
51 -
 52
52 -
 53
53 -
 54
54 -
 55
55 -
 56
56 -
 57
57 -
 58
58 -
 59
59 -
 60
60 -
 61
61 -
62
-
63
-
64
-
65
-
66
-
67
-
68
-
69
-
70
-
71
-
72
-
73
-
74
-
75
-
76
-
77
-
78
-
79
-
80
-
81
-
82
-
83
-
84
-
85
-
86
-
87
-
88
-
89
-
90
-
91
-
92
-
93
-
94
-
95
-
96
-
97
-
98
-
99
-
100
-
101
-
102
-
103
-
104
-
105
-
106
-
107
-
108
-
109
-
110
-
111
-
112
-
113
-
114
-
115
-
116
-
117
-
118
-
119
-
120
-
121
-
122
-
123
-
124
-
125
-
126
-
127
-
128
-
129
-
130
-
131
-
132
-
133
-
134
-
135
-
136
-
137
-
138
-
139
-
140
-
141
-
142
-
143
-
144
-
145
-
146
-
147
-
148
-
149
-
150
-
151
-
152
-
153
-
154
-
155
-
156
-
157
-
158
-
159
-
160
-
161
-
162
-
163
-
164
-
165
-
166
-
167
-
168
-
169
-
170
-
171
-
172
-
173
-
174
-
175
-
176
-
177
-
178
-
179
-
180
-
181
-
182
-
183
-
184
-
185
-
186
-
187
-
188
-
189
-
190
-
191
-
192
-
193
-
194
-
195
-
196
-
197
-
198
-
199
-
200
-
201
-
202
-
203
 |
 |

Table of Contents
18% from fiscal year 2007, with our share of the desktop and enterprise markets increasing by 5% and 6%, respectively, while our share of the
mobile compute and consumer electronic markets declined by 6% and 10%, respectively. The increase in the number of units shipped and an
improved mix of products shipped was partially offset by price erosion, which was relatively benign during the first half of the fiscal year as a
result of favorable industry conditions, including well-balanced disc drive supply and demand, while being more pronounced during the second
half of fiscal year 2008, as is consistent with historical seasonal patterns.
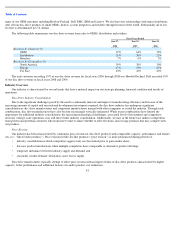
Our overall average sales price per unit (ASP) for our products was $68 for fiscal year 2008, down from $71 in fiscal year 2007, as an
improved mix of products shipped was more than offset by price erosion.
Unit shipments for our products in fiscal year 2008 were as follows:
•
Enterprise—20.3 million, up from 16.7 million units in fiscal year 2007.
•
Mobile—26.7 million, up from 19.4 million units in fiscal year 2007.
•
Desktop
—
111 million, up from 97.8 million units in fiscal year 2007.
We maintain various sales programs such as point-of-sale rebates, sales price adjustments and price protection, aimed at increasing
customer demand. We exercise judgment in formulating the underlying estimates related to distributor and retail inventory levels, sales program
participation and customer claims submittals in determining the provision for such programs. Sales programs recorded as contra revenue were
approximately 9% of our gross revenue, for both fiscal years 2008 and 2007.
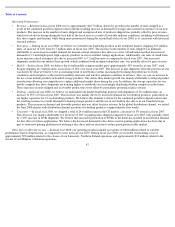
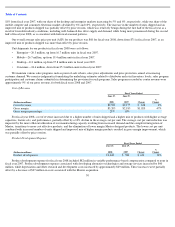
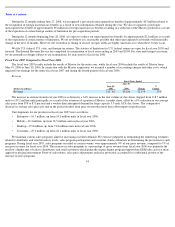
Cost of Revenue
For fiscal year 2008, cost of revenue increased due to a higher number of units shipped and a higher mix of products with higher average
capacities, feature sets, and performance, partially offset by a 10% decline in the average cost per unit. The average cost per unit reduction was
impacted by the more efficient utilization of our manufacturing capacity resulting from increased demand and the completed integration of
Maxtor, transitions to more cost effective products, and the elimination of lower margin Maxtor designed products. The lower cost per unit
combined with increased number of units shipped and improved mix of higher margin products resulted in gross margin improvement, which
was partially offset by price erosion.
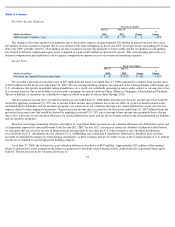
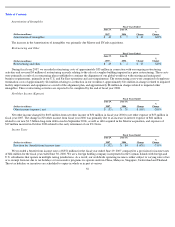
Product Development Expense
Product development expense for fiscal year 2008 included $82 million in variable performance-based compensation compared to none in
fiscal year 2007. Product development expenses associated with developing alternative technologies and storage services increased by $40
million, while depreciation and other research and development costs increased by approximately $29 million. These increases were partially
offset by a decrease of $27 million in costs associated with the Maxtor acquisition.
50
•
Consumer—24.6 million, down from 25.3 million units in fiscal year 2007.
Fiscal Years Ended
(Dollars in millions)
June 27,
2008
June 29,
2007
Change
%
Change
Cost of revenue
$
9,503
$
9,175
$
328
4
%
Gross margin
$
3,205
$
2,185
$
1,020
47
%
Gross margin percentage
25%
19%
Fiscal Years Ended
(Dollars in millions)
June 27,
2008
June 29,
2007
Change
%
Change
Product development
$
1,028
$
904
$
124
14
%