Seagate 2007 Annual Report Download - page 55
Download and view the complete annual report
Please find page 55 of the 2007 Seagate annual report below. You can navigate through the pages in the report by either clicking on the pages listed below, or by using the keyword search tool below to find specific information within the annual report.-
 1
1 -
2
-
3
-
4
-
5
-
6
-
7
-
8
-
9
-
10
-
11
-
12
-
13
-
14
-
15
-
16
-
17
-
18
-
19
-
20
-
21
-
22
-
23
-
24
-
25
-
26
-
27
-
28
-
29
-
30
-
31
-
32
-
33
-
34
-
35
-
36
-
37
-
38
-
39
-
40
-
41
-
42
-
43
-
44
-
 45
45 -
 46
46 -
 47
47 -
 48
48 -
 49
49 -
 50
50 -
 51
51 -
 52
52 -
 53
53 -
 54
54 -
 55
55 -
 56
56 -
 57
57 -
 58
58 -
 59
59 -
 60
60 -
 61
61 -
 62
62 -
 63
63 -
 64
64 -
 65
65 -
66
-
67
-
68
-
69
-
70
-
71
-
72
-
73
-
74
-
75
-
76
-
77
-
78
-
79
-
80
-
81
-
82
-
83
-
84
-
85
-
86
-
87
-
88
-
89
-
90
-
91
-
92
-
93
-
94
-
95
-
96
-
97
-
98
-
99
-
100
-
101
-
102
-
103
-
104
-
105
-
106
-
107
-
108
-
109
-
110
-
111
-
112
-
113
-
114
-
115
-
116
-
117
-
118
-
119
-
120
-
121
-
122
-
123
-
124
-
125
-
126
-
127
-
128
-
129
-
130
-
131
-
132
-
133
-
134
-
135
-
136
-
137
-
138
-
139
-
140
-
141
-
142
-
143
-
144
-
145
-
146
-
147
-
148
-
149
-
150
-
151
-
152
-
153
-
154
-
155
-
156
-
157
-
158
-
159
-
160
-
161
-
162
-
163
-
164
-
165
-
166
-
167
-
168
-
169
-
170
-
171
-
172
-
173
-
174
-
175
-
176
-
177
-
178
-
179
-
180
-
181
-
182
-
183
-
184
-
185
-
186
-
187
-
188
-
189
-
190
-
191
-
192
-
193
-
194
-
195
-
196
-
197
-
198
-
199
-
200
-
201
-
202
-
203
 |
 |

Table of Contents
During the 12 months ending June 27, 2008, we recognized a previously unrecognized tax benefit of approximately $13 million related to
the recognition of foreign uncertain tax benefits as a result of new information obtained during the year. We also recognized a previously
unrecognized tax benefit of approximately $9 million for foreign uncertain tax benefits resulting in a reduction of the Maxtor goodwill as a result
of the expiration of certain foreign statutes of limitation for pre-acquisition periods.
During the 12 months beginning June 28, 2008, we expect to reduce our unrecognized tax benefits by approximately $21 million as a result
of the expiration of certain statutes of limitation. We do not believe it is reasonably possible that other unrecognized tax benefits will materially
change in the next 12 months. However, the resolution or timing of closure on open audits are highly uncertain as to when these events occur.
We file U.S. federal, U.S. state, and foreign tax returns. The statutes of limitation for U.S. federal returns are open for fiscal year 2003 and
forward. The Internal Revenue Service has completed its examination of fiscal years ending in 2003 and 2004. For state and foreign tax returns,
we are generally no longer subject to tax examinations for years prior to fiscal year 2001.
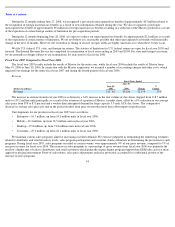
Fiscal Year 2007 Compared to Fiscal Year 2006
The fiscal year 2007 results include the results of Maxtor for the entire year, while fiscal year 2006 include the results of Maxtor from
May 19, 2006 to June 30, 2006. In connection with the Maxtor acquisition, we incurred a number of accounting charges and other costs, which
impacted our earnings for the entire fiscal year 2007 and during the fourth quarter of fiscal year 2006.
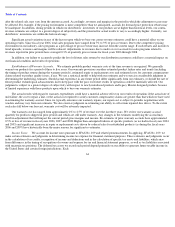
Revenue
The increase in revenue from fiscal year 2006 was driven by a 34% increase in the unit volume of disc drives shipped from 118.7 million
units to 159.2 million units principally as a result of the retention of a portion of Maxtor’s market share, offset by a 9% reduction in our average
sales price from $78 to $71 per unit and a weaker than anticipated demand for large capacity 3.5-inch ATA disc drives. The comparative
decrease in average sales price per unit in the period resulted from price erosion that more than offset improved product mix.
Unit shipments for our products in fiscal year 2007 were as follows:
Fiscal Years Ended
(Dollars in millions)
June 29,
2007
June 30,
2006
Change
%
Change
Revenue
$
11,360
$
9,206
$
2,154
23
%
•
Enterprise
—
16.7 million, up from 14.3 million units in fiscal year 2006.
•
Mobile—19.4 million, up from 12.5 million units in fiscal year 2006.
•
Desktop
—
97.8 million, up from 73.8 million units in fiscal year 2006.
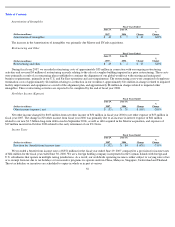
We maintain various sales programs aimed at increasing customer demand. We exercise judgment in formulating the underlying estimates
related to distributor and retail inventory levels, sales program participation and customer claims submittals in determining the provision for such
programs. During fiscal year 2007, sales programs recorded as contra revenue, were approximately 9% of our gross revenue, compared to 7% of
our gross revenue for fiscal year 2006. The increase in sales programs as a percentage of gross revenue from fiscal year 2006 was primarily the
result of a higher mix of sales to distributors and retail customers which generally require higher program support than OEM sales and to a more
aggressive pricing environment. Point-of-sale rebates, sales price adjustments and price protection accounted for a substantial portion of the
increase in sales programs.
54
•
Consumer—25.3 million, up from 18.1 million units in fiscal year 2006.