Seagate 2007 Annual Report Download - page 74
Download and view the complete annual report
Please find page 74 of the 2007 Seagate annual report below. You can navigate through the pages in the report by either clicking on the pages listed below, or by using the keyword search tool below to find specific information within the annual report.-
 1
1 -
2
-
3
-
4
-
5
-
6
-
7
-
8
-
9
-
10
-
11
-
12
-
13
-
14
-
15
-
16
-
17
-
18
-
19
-
20
-
21
-
22
-
23
-
24
-
25
-
26
-
27
-
28
-
29
-
30
-
31
-
32
-
33
-
34
-
35
-
36
-
37
-
38
-
39
-
40
-
41
-
42
-
43
-
44
-
45
-
46
-
47
-
48
-
49
-
50
-
51
-
52
-
53
-
54
-
55
-
56
-
57
-
58
-
59
-
60
-
61
-
62
-
63
-
 64
64 -
 65
65 -
 66
66 -
 67
67 -
 68
68 -
 69
69 -
 70
70 -
 71
71 -
 72
72 -
 73
73 -
 74
74 -
 75
75 -
 76
76 -
 77
77 -
 78
78 -
 79
79 -
 80
80 -
 81
81 -
 82
82 -
 83
83 -
 84
84 -
85
-
86
-
87
-
88
-
89
-
90
-
91
-
92
-
93
-
94
-
95
-
96
-
97
-
98
-
99
-
100
-
101
-
102
-
103
-
104
-
105
-
106
-
107
-
108
-
109
-
110
-
111
-
112
-
113
-
114
-
115
-
116
-
117
-
118
-
119
-
120
-
121
-
122
-
123
-
124
-
125
-
126
-
127
-
128
-
129
-
130
-
131
-
132
-
133
-
134
-
135
-
136
-
137
-
138
-
139
-
140
-
141
-
142
-
143
-
144
-
145
-
146
-
147
-
148
-
149
-
150
-
151
-
152
-
153
-
154
-
155
-
156
-
157
-
158
-
159
-
160
-
161
-
162
-
163
-
164
-
165
-
166
-
167
-
168
-
169
-
170
-
171
-
172
-
173
-
174
-
175
-
176
-
177
-
178
-
179
-
180
-
181
-
182
-
183
-
184
-
185
-
186
-
187
-
188
-
189
-
190
-
191
-
192
-
193
-
194
-
195
-
196
-
197
-
198
-
199
-
200
-
201
-
202
-
203
 |
 |
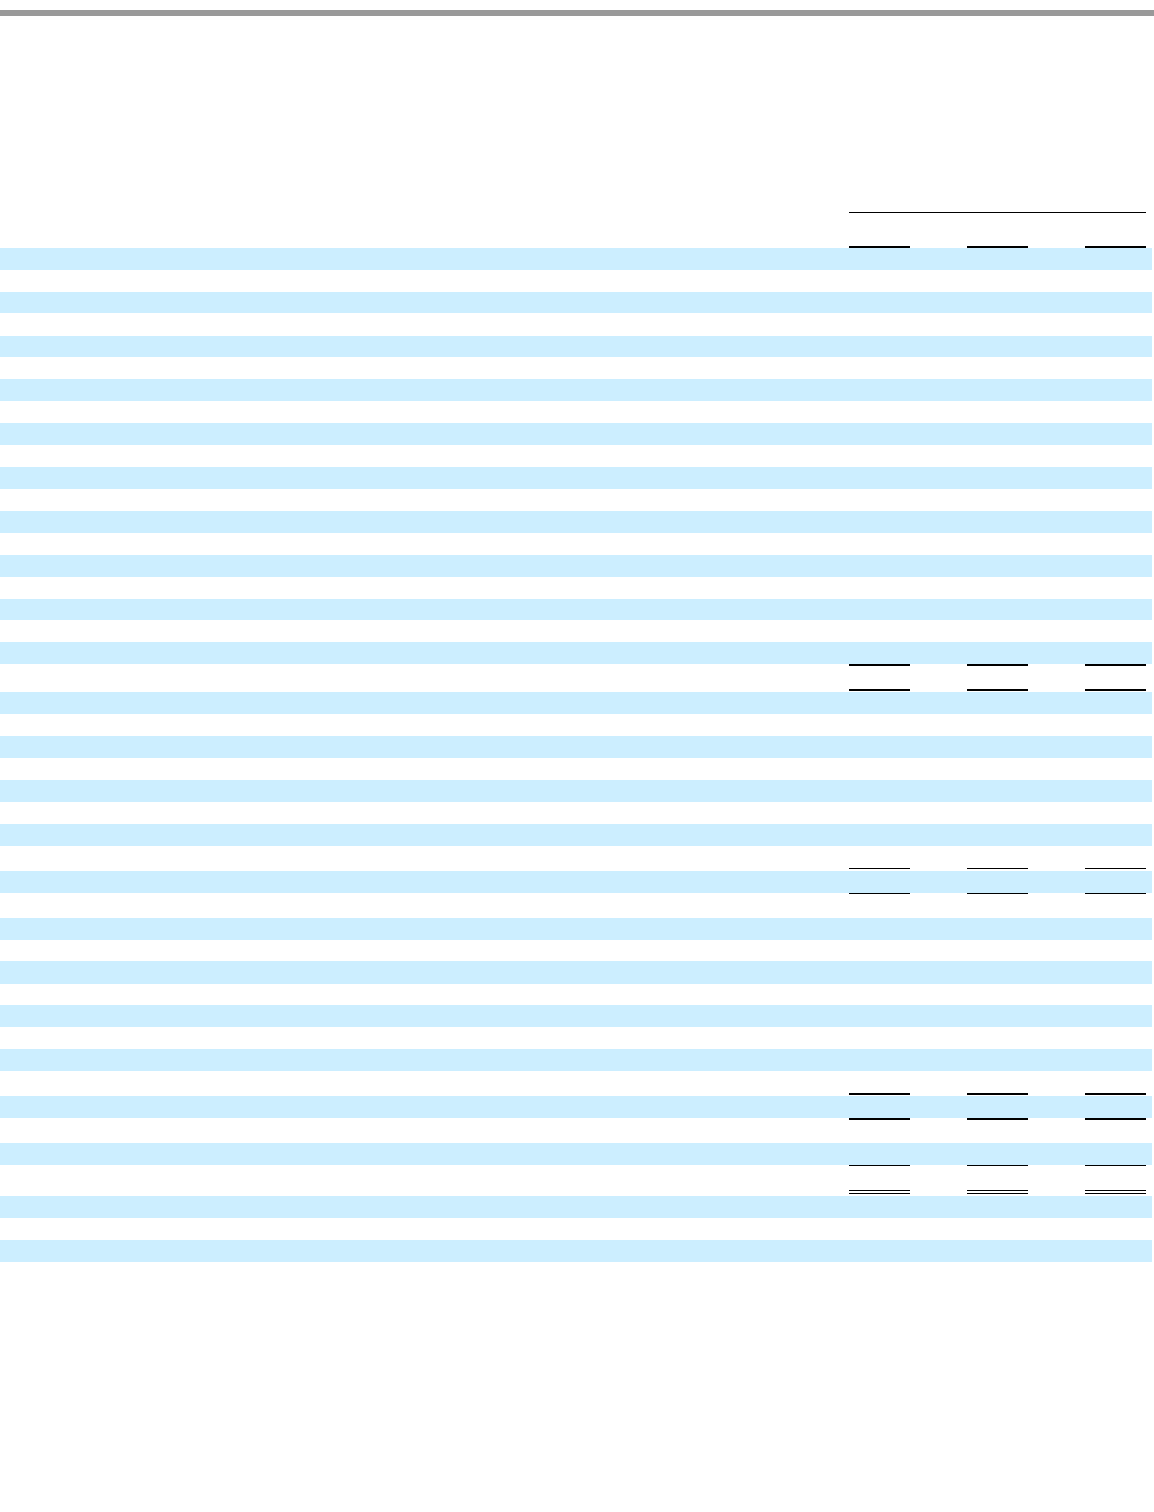
Table of Contents
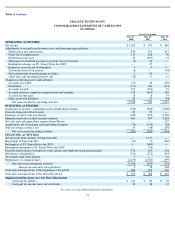
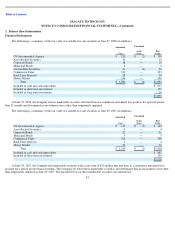
SEAGATE TECHNOLOGY
CONSOLIDATED STATEMENTS OF CASH FLOWS
(In millions)
See notes to consolidated financial statements.
73
Fiscal Year Ended
June 27,
2008
June 29,
2007
June 30,
2006
OPERATING ACTIVITIES
Net income
$
1,262
$
913
$
840
Adjustments to reconcile net income to net cash from operating activities:
Depreciation and amortization
844
851
612
Stock
-
based compensation
113
128
90
Deferred income taxes
10
(365
)
23
Allowance for doubtful accounts receivable, net of recoveries
(3
)
40
—
Redemption charges on 8% Senior Notes due 2009
—
19
—
In
-
process research and development
4
4
—
Tax benefit from stock options
(6
)
—
(
44
)
Non
-
cash portion of restructuring and other
2
19
—
Other non
-
cash operating activities, net
(12
)
17
12
Changes in operating assets and liabilities:
Accounts receivable
(67
)
34
(190
)
Inventories
(151
)
106
(113
)
Accounts payable
351
(391
)
91
Accrued expenses, employee compensation and warranty
154
(465
)
120
Accrued income taxes
13
8
54
Other assets and liabilities
24
25
(38
)
Net cash provided by operating activities
2,538
943
1,457
INVESTING ACTIVITIES
Acquisition of property, equipment and leasehold improvements
(930
)
(906
)
(1,008
)
Proceeds from sale of fixed assets
29
55
—
Purchases of short
-
term investments
(486
)
(322
)
(3,220
)
Maturities and sales of short
-
term investments
460
997
3,528
Net cash and cash equivalents acquired from Maxtor
—
—
297
Acquisitions, net of cash and cash equivalents acquired
(78
)
(178
)
(28
)
Other investing activities, net
14
(48
)
(130
)
Net cash used in investing activities
(991
)
(402
)
(561
)
FINANCING ACTIVITIES
Net proceeds from issuance of long
-
term debt
—
1,477
—
Repayment of long
-
term debt
(34
)
(5
)
(340
)
Redemption of 8% Senior Notes due 2009
—
(
400
)
—
Redemption premium on 8% Senior Notes due 2009
—
(
16
)
—
Proceeds from exercise of employee stock options and employee stock purchase plan
178
219
118
Dividends to shareholders
(216
)
(212
)
(155
)
Tax benefit from stock options
6
—
44
Repurchases of common shares
(1,479
)
(1,526
)
(399
)
Net cash used in financing activities
(1,545
)
(463
)
(732
)
Increase in cash and cash equivalents
2
78
164
Cash and cash equivalents at the beginning of the period
988
910
746
Cash and cash equivalents at the end of the period
$
990
$
988
$
910
Supplemental Disclosure of Cash Flow Information
Cash paid for interest
$
121
$
88
$
38
Cash paid for income taxes, net of refunds
34
38
15