Seagate 2007 Annual Report Download - page 103
Download and view the complete annual report
Please find page 103 of the 2007 Seagate annual report below. You can navigate through the pages in the report by either clicking on the pages listed below, or by using the keyword search tool below to find specific information within the annual report.-
 1
1 -
2
-
3
-
4
-
5
-
6
-
7
-
8
-
9
-
10
-
11
-
12
-
13
-
14
-
15
-
16
-
17
-
18
-
19
-
20
-
21
-
22
-
23
-
24
-
25
-
26
-
27
-
28
-
29
-
30
-
31
-
32
-
33
-
34
-
35
-
36
-
37
-
38
-
39
-
40
-
41
-
42
-
43
-
44
-
45
-
46
-
47
-
48
-
49
-
50
-
51
-
52
-
53
-
54
-
55
-
56
-
57
-
58
-
59
-
60
-
61
-
62
-
63
-
64
-
65
-
66
-
67
-
68
-
69
-
70
-
71
-
72
-
73
-
74
-
75
-
76
-
77
-
78
-
79
-
80
-
81
-
82
-
83
-
84
-
85
-
86
-
87
-
88
-
89
-
90
-
91
-
92
-
 93
93 -
 94
94 -
 95
95 -
 96
96 -
 97
97 -
 98
98 -
 99
99 -
 100
100 -
 101
101 -
 102
102 -
 103
103 -
 104
104 -
 105
105 -
 106
106 -
 107
107 -
 108
108 -
 109
109 -
 110
110 -
 111
111 -
 112
112 -
 113
113 -
114
-
115
-
116
-
117
-
118
-
119
-
120
-
121
-
122
-
123
-
124
-
125
-
126
-
127
-
128
-
129
-
130
-
131
-
132
-
133
-
134
-
135
-
136
-
137
-
138
-
139
-
140
-
141
-
142
-
143
-
144
-
145
-
146
-
147
-
148
-
149
-
150
-
151
-
152
-
153
-
154
-
155
-
156
-
157
-
158
-
159
-
160
-
161
-
162
-
163
-
164
-
165
-
166
-
167
-
168
-
169
-
170
-
171
-
172
-
173
-
174
-
175
-
176
-
177
-
178
-
179
-
180
-
181
-
182
-
183
-
184
-
185
-
186
-
187
-
188
-
189
-
190
-
191
-
192
-
193
-
194
-
195
-
196
-
197
-
198
-
199
-
200
-
201
-
202
-
203
 |
 |

Table of Contents
SEAGATE TECHNOLOGY
NOTES TO CONSOLIDATED FINANCIAL STATEMENTS
—
(
Continued)
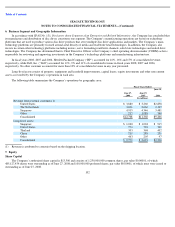
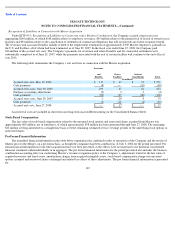
6. Business Segment and Geographic Information
In accordance with SFAS No. 131,
Disclosure about Segments of an Enterprise and Related Information
, the Company has concluded that
its manufacture and distribution of disc drives constitutes one segment. The Company’s manufacturing operations are based on technology
platforms that are used to produce various disc drive products that serve multiple disc drive applications and markets. The Company’s main
technology platforms are primarily focused around areal density of media and read/write head technologies. In addition, the Company also
invests in certain other technology platforms including motors, servo formatting read/write channels, solid state technologies and sealed drive
technologies. The Company has determined that its Chief Executive Officer is the Company’s chief operating decision maker (CODM) as he is
responsible for reviewing and approving investments in the Company’s technology platforms and manufacturing infrastructure.
In fiscal years 2008, 2007 and 2006, Hewlett-Packard Company (“HP”) accounted for 16%, 16% and 17% of consolidated revenue,
respectively, while Dell, Inc. (“Dell”) accounted for 11%, 9% and 11% of consolidated revenue in fiscal years 2008, 2007 and 2006,
respectively. No other customer accounted for more than 10% of consolidated revenue in any year presented.
Long-lived assets consist of property, equipment and leasehold improvements, capital leases, equity investments and other non-current
assets as recorded by the Company’s operations in each area.
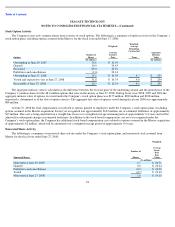
The following table summarizes the Company’s operations by geographic area:
7. Equity
Fiscal Years Ended
June 27,
2008
June 29,
2007
June 30,
2006
(In millions)
Revenue from external customers(1):
United States
$
3,880
$
3,260
$
2,858
The Netherlands
3,696
2,666
2,127
Singapore
4,915
4,346
3,481
Other
217
1,088
740
Consolidated
$
12,708
$
11,360
$
9,206
Long
-
lived assets:
Singapore
$
1,020
$
1,038
$
915
United States
774
792
701
Thailand
303
368
432
China
210
288
251
Other
463
205
97
Consolidated
$
2,770
$
2,691
$
2,396
(1)
Revenue is attributed to countries based on the shipping location.
Share Capital
The Company
’
s authorized share capital is $13,500 and consists of 1,250,000,000 common shares, par value $0.00001, of which
485,127,434 shares were outstanding as of June 27, 2008 and 100,000,000 preferred shares, par value $0.00001, of which none were issued or
outstanding as of June 27, 2008.
102