Food Lion 2014 Annual Report Download - page 97
Download and view the complete annual report
Please find page 97 of the 2014 Food Lion annual report below. You can navigate through the pages in the report by either clicking on the pages listed below, or by using the keyword search tool below to find specific information within the annual report.-
 1
1 -
2
-
3
-
4
-
5
-
6
-
7
-
8
-
9
-
10
-
11
-
12
-
13
-
14
-
15
-
16
-
17
-
18
-
19
-
20
-
21
-
22
-
23
-
24
-
25
-
26
-
27
-
28
-
29
-
30
-
31
-
32
-
33
-
34
-
35
-
36
-
37
-
38
-
39
-
40
-
41
-
42
-
43
-
44
-
45
-
46
-
47
-
48
-
49
-
50
-
51
-
52
-
53
-
54
-
55
-
56
-
57
-
58
-
59
-
60
-
61
-
62
-
63
-
64
-
65
-
66
-
67
-
68
-
69
-
70
-
71
-
72
-
73
-
74
-
75
-
76
-
77
-
78
-
79
-
80
-
81
-
82
-
83
-
84
-
85
-
86
-
 87
87 -
 88
88 -
 89
89 -
 90
90 -
 91
91 -
 92
92 -
 93
93 -
 94
94 -
 95
95 -
 96
96 -
 97
97 -
 98
98 -
 99
99 -
 100
100 -
 101
101 -
 102
102 -
 103
103 -
 104
104 -
 105
105 -
 106
106 -
 107
107 -
108
-
109
-
110
-
111
-
112
-
113
-
114
-
115
-
116
-
117
-
118
-
119
-
120
-
121
-
122
-
123
-
124
-
125
-
126
-
127
-
128
-
129
-
130
-
131
-
132
-
133
-
134
-
135
-
136
-
137
-
138
-
139
-
140
-
141
-
142
-
143
-
144
-
145
-
146
-
147
-
148
-
149
-
150
-
151
-
152
-
153
-
154
-
155
-
156
-
157
-
158
-
159
-
160
-
161
-
162
-
163
-
164
-
165
-
166
-
167
-
168
-
169
-
170
-
171
-
172
 |
 |
DELHAIZE GROUP FINANCIAL STATEMENTS 2014 // 93
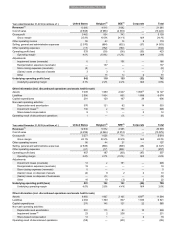
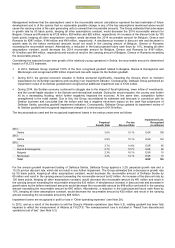
Year ended December 31, 2014 (in millions of €)
United States
Belgium
(2)
SEE
(3)
Corporate
Total
Revenues
(1)
13 360
4 919
3 082
—
21 361
Cost of sales
(9 898)
(3 985)
(2 339)
—
(16 222)
Gross profit
3 462
934
743
—
5 139
Gross margin
25.9%
19.0%
24.1%
N/A
24.1%
Other operating income
58
43
16
2
119
Selling, general and administrative expenses
(2 970)
(864)
(632)
(37)
(4 503)
Other operating expenses
(17)
(152)
(163)
—
(332)
Operating profit (loss)
533
(39)
(36)
(35)
423
Operating margin
4.0%
(0.8%)
(1.2%)
N/A
2.0%
Adjustments:
Impairment losses (reversals)
8
2
156
—
166
Reorganization expenses (reversals)
—
137
—
—
137
Store closing expenses (reversals)
(2)
—
—
—
(2)
(Gains) losses on disposal of assets
3
3
1
—
7
Other
—
15
14
2
31
Underlying operating profit (loss)
542
118
135
(33)
762
Underlying operating margin
4.1%
2.4%
4.4%
N/A
3.6%
Other information (incl. discontinued operations and assets held for sale)
Assets
7 095
1 889
2 047
1 096
(5)
12 127
Liabilit
ies
2 506
1 604
865
1 699
6 674
Capital expenditures
281
129
167
29
606
Non
-cash operating activities:
Depreciation and amortization
376
121
82
14
593
Impairment losses
(4)
134
2
170
—
306
Share-based compensation
9
1
—
2
12
Operating result of discontinued operations
1
—
(9)
—
(8)
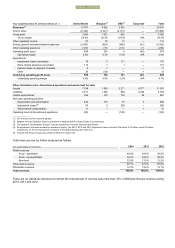
Year ended December 31, 2013 (in millions of €)
United States
Belgium
(2)
SEE
(3)
Corporate
Total
Revenues
(1)
12 536
5 072
2 985
—
20 593
Cost of sales
(9 259)
(4 046)
(2 274)
—
(15 579)
Gross profit
3 277
1 026
711
—
5 014
Gross margin
26.1%
20.2%
23.8%
N/A
24.3%
Other operating income
56
44
27
—
127
Selling, general and administrative expenses
(2 835)
(866)
(598)
(48)
(4 347)
Other operating expenses
(41)
(17)
(200)
1
(257)
O
perating profit (loss)
457
187
(60)
(47)
537
Operating margin
3.6%
3.7%
(2.0%)
N/A
2.6%
Adjustments:
Impairment losses (reversals)
13
2
191
—
206
Reorganization expenses (reversals)
18
—
—
—
18
Store closing expenses (reversals)
5
—
—
—
5
(Gains) losses on disposal of assets
(2)
8
2
2
10
(Gains) losses on disposal of businesses
—
(9)
—
—
(9)
Other
10
10
(3)
5
22
Underlying operating profit (loss)
501
198
130
(40)
789
Underlying operating margin
4.0%
3.9%
4.4%
N/A
3.8%
Other information (incl. discontinued operations and assets held for sale)
Assets
6 983
1 867
2 105
639
(5)
11 594
Liabilities
2 482
1 399
807
1 833
6 52
1
Capital expenditures
276
140
127
22
565
Non
-cash operating activities:
Depreciation and amortization
391
115
83
10
599
Impairment losses
(4)
23
2
206
—
231
Share-based compensation
13
1
—
2
16
Operating result of discontinued operations
(58)
—
(28)
—
(86)
Delhaize Group Annual Report 2014 • 95