Food Lion 2014 Annual Report Download - page 108
Download and view the complete annual report
Please find page 108 of the 2014 Food Lion annual report below. You can navigate through the pages in the report by either clicking on the pages listed below, or by using the keyword search tool below to find specific information within the annual report.-
 1
1 -
2
-
3
-
4
-
5
-
6
-
7
-
8
-
9
-
10
-
11
-
12
-
13
-
14
-
15
-
16
-
17
-
18
-
19
-
20
-
21
-
22
-
23
-
24
-
25
-
26
-
27
-
28
-
29
-
30
-
31
-
32
-
33
-
34
-
35
-
36
-
37
-
38
-
39
-
40
-
41
-
42
-
43
-
44
-
45
-
46
-
47
-
48
-
49
-
50
-
51
-
52
-
53
-
54
-
55
-
56
-
57
-
58
-
59
-
60
-
61
-
62
-
63
-
64
-
65
-
66
-
67
-
68
-
69
-
70
-
71
-
72
-
73
-
74
-
75
-
76
-
77
-
78
-
79
-
80
-
81
-
82
-
83
-
84
-
85
-
86
-
87
-
88
-
89
-
90
-
91
-
92
-
93
-
94
-
95
-
96
-
97
-
 98
98 -
 99
99 -
 100
100 -
 101
101 -
 102
102 -
 103
103 -
 104
104 -
 105
105 -
 106
106 -
 107
107 -
 108
108 -
 109
109 -
 110
110 -
 111
111 -
 112
112 -
 113
113 -
 114
114 -
 115
115 -
 116
116 -
 117
117 -
 118
118 -
119
-
120
-
121
-
122
-
123
-
124
-
125
-
126
-
127
-
128
-
129
-
130
-
131
-
132
-
133
-
134
-
135
-
136
-
137
-
138
-
139
-
140
-
141
-
142
-
143
-
144
-
145
-
146
-
147
-
148
-
149
-
150
-
151
-
152
-
153
-
154
-
155
-
156
-
157
-
158
-
159
-
160
-
161
-
162
-
163
-
164
-
165
-
166
-
167
-
168
-
169
-
170
-
171
-
172
 |
 |
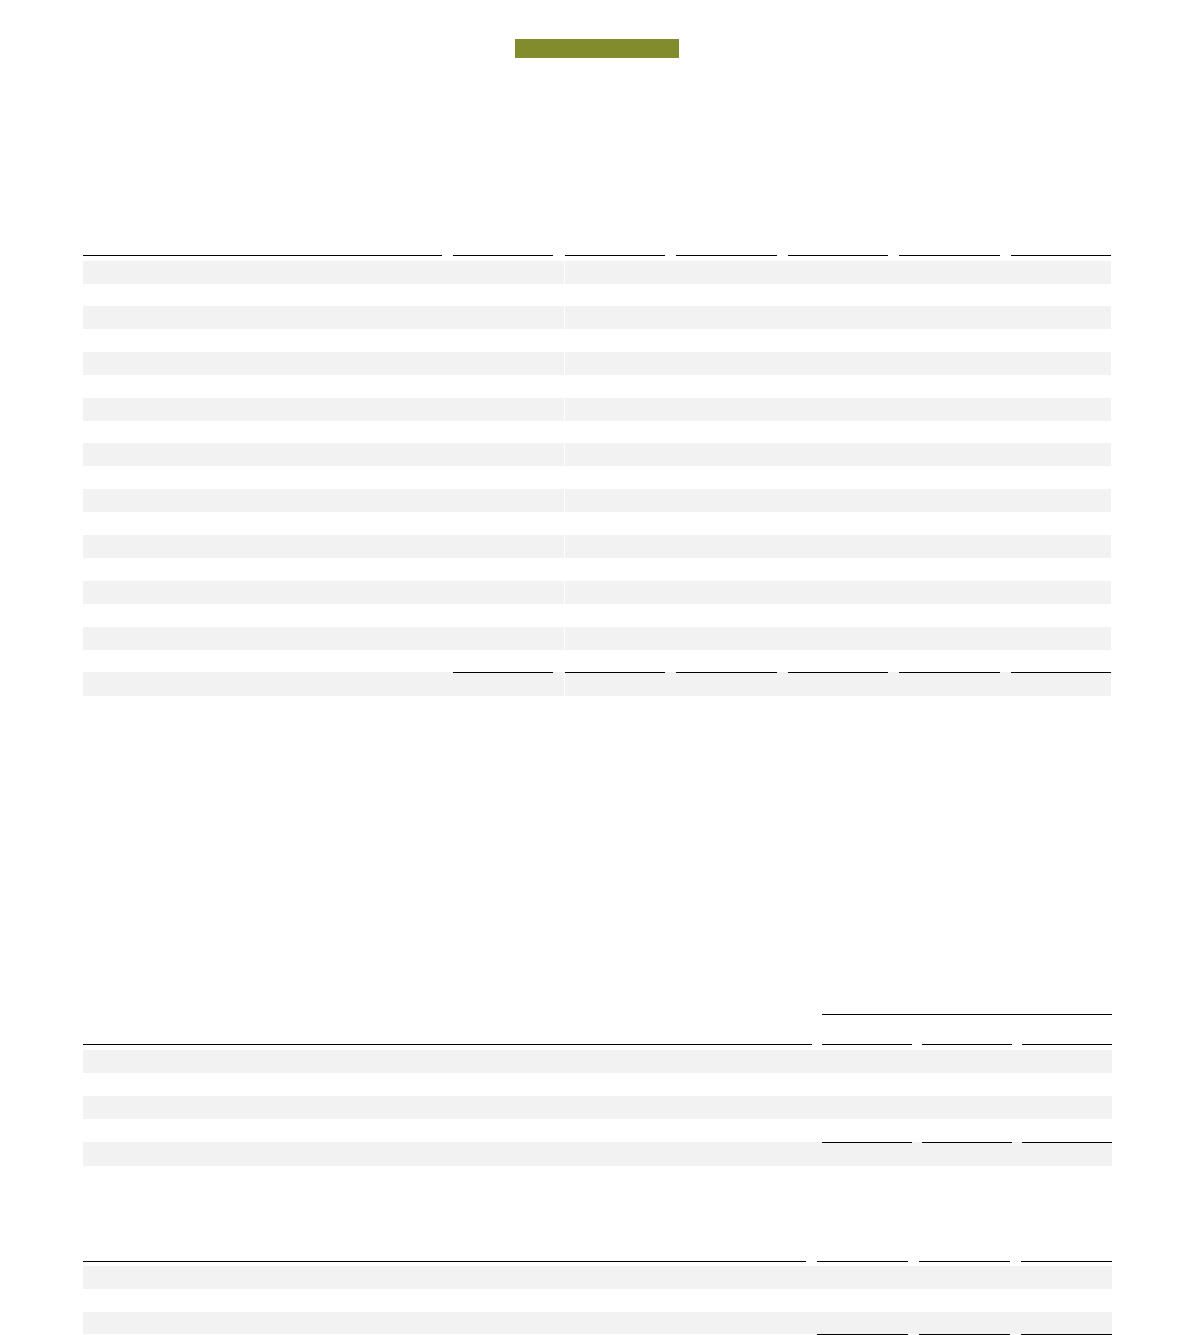
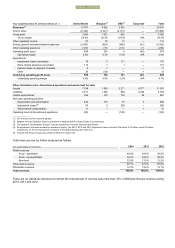
104 // DELHAIZE GROUP FINANCIAL STATEMENTS 2014
(in millions of €)
Land and
Buildings
Leasehold
Improve
-
ments
Furniture,
Fixtu
res,
Equipment
and
Vehicles
Construction
in Progress
and Advance
Payments
Property
under
Finance
Leases
Total
Property,
Plant and
Equipment
Cost at January 1, 2012
2 530
1 897
3 612
86
969
9 094
Additions
94
100
244
145
14
5
97
Sales and disposals
(21)
(110)
(228)
(4)
(26)
(389)
Acquisitions through business combinations
3
—
1
—
—
4
Transfers (to) from other accounts
29
56
40
(185)
(87)
(147)
Currency translation effect
(48)
(28)
(55)
—
(14)
(145)
Classified as held for sale
(1)
(1)
(12)
—
—
(14)
Cost at December 31, 2012
2 586
1 914
3 602
42
856
9 000
Accumulated depreciation at January 1, 2012
(735)
(1 123)
(2 109)
—
(422)
(4 389)
Accumulated impairment at January 1, 2012
(18)
(34)
(62)
—
(56)
(170)
Depreciation expense
(93)
(132)
(292)
—
(50)
(567)
Impairment losses
(15)
(23)
(36)
(1)
(12)
(87)
Sales and disposals
14
109
209
—
25
357
Transfers to (from) other accounts
10
1
4
—
79
94
Currency translation effect
11
17
34
—
9
71
Classified as held for sale
—
—
5
—
—
5
Accumulated depreciation at December 31, 2012
(800)
(1 156)
(2 194)
—
(407)
(4 557)
Accumulated impairment at December 31, 2012
(26)
(29)
(53)
(1)
(20)
(129)
Net carrying amount at December 31, 2012
1 760
729
1 355
41
429
4 314
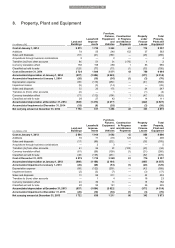
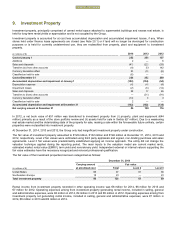
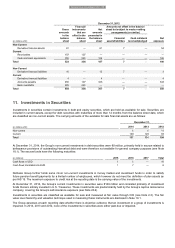
During 2014, the Group reclassified property, plant and equipment to assets classified as held for sale for a total amount of €224
million as a result of the (planned) disposal of the banner Bottom Dollar Food, a Sweetbay distribution center (total of €205
million at Delhaize America), Delhaize Bosnia & Herzegovina (€11 million) and the Bulgarian operations (€8 million).
During 2013, the Group reclassified property, plant and equipment to assets classified as held for sale for a total amount of €177
million, of which €161 million related to the planned disposal of Sweetbay, Harveys and Reid’s and €16 million to the disposal of
Delhaize Montenegro (see Note 5).
In 2014, the Group reclassified property, plant and equipment to investment property for €0 million (see Note 9; 2013 and 2012,
€2 million and €44 million, respectively). In accordance with the Group’s policy, closed stores held under finance lease
agreements are reclassified to investment property.
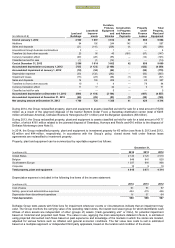
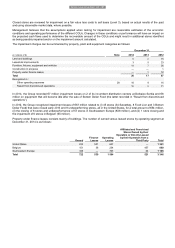
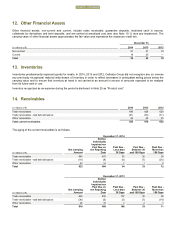
Property, plant and equipment can be summarized by reportable segment as follows:
December 31,
(in millions of €)
2014
2013
2012
United States
2 120
2 129
2 510
Belgium
848
841
828
Southeastern Europe
1 037
994
966
Corporate
10
9
10
Total property, plant and equipment
4 015
3 973
4 314
Depreciation expense is included in the following line items of the income statement:
(in millions of €)
2014
2013
2012
Cost of sales
60
56
57
Selling, general and administrative expenses
424
415
446
Depreciation from discontinued operations
16
37
64
Total depreciation
500
508
567
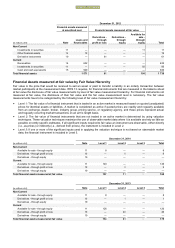
Delhaize Group tests assets with finite lives for impairment whenever events or circumstances indicate that an impairment may
exist. The Group monitors the carrying value of its operating retail stores, the lowest level asset group for which identifiable cash
inflows of store assets are independent of other (groups of) assets (“cash-generating unit” or CGU), for potential impairment
based on historical and projected cash flows. The value in use, applying the main assumptions detailed in Note 6, is estimated
using projected discounted cash flows based on past experience and knowledge of the markets in which the stores are located,
adjusted for various factors such as inflation and general economic conditions. The fair value less costs to sell is estimated
based on a multiples approach or independent third party appraisals, based on the location and condition of the stores.
FINANCIAL STATEMENTS