Food Lion 2014 Annual Report Download - page 79
Download and view the complete annual report
Please find page 79 of the 2014 Food Lion annual report below. You can navigate through the pages in the report by either clicking on the pages listed below, or by using the keyword search tool below to find specific information within the annual report.-
 1
1 -
2
-
3
-
4
-
5
-
6
-
7
-
8
-
9
-
10
-
11
-
12
-
13
-
14
-
15
-
16
-
17
-
18
-
19
-
20
-
21
-
22
-
23
-
24
-
25
-
26
-
27
-
28
-
29
-
30
-
31
-
32
-
33
-
34
-
35
-
36
-
37
-
38
-
39
-
40
-
41
-
42
-
43
-
44
-
45
-
46
-
47
-
48
-
49
-
50
-
51
-
52
-
53
-
54
-
55
-
56
-
57
-
58
-
59
-
60
-
61
-
62
-
63
-
64
-
65
-
66
-
67
-
68
-
 69
69 -
 70
70 -
 71
71 -
 72
72 -
 73
73 -
 74
74 -
 75
75 -
 76
76 -
 77
77 -
 78
78 -
 79
79 -
 80
80 -
 81
81 -
 82
82 -
 83
83 -
 84
84 -
 85
85 -
 86
86 -
 87
87 -
 88
88 -
 89
89 -
90
-
91
-
92
-
93
-
94
-
95
-
96
-
97
-
98
-
99
-
100
-
101
-
102
-
103
-
104
-
105
-
106
-
107
-
108
-
109
-
110
-
111
-
112
-
113
-
114
-
115
-
116
-
117
-
118
-
119
-
120
-
121
-
122
-
123
-
124
-
125
-
126
-
127
-
128
-
129
-
130
-
131
-
132
-
133
-
134
-
135
-
136
-
137
-
138
-
139
-
140
-
141
-
142
-
143
-
144
-
145
-
146
-
147
-
148
-
149
-
150
-
151
-
152
-
153
-
154
-
155
-
156
-
157
-
158
-
159
-
160
-
161
-
162
-
163
-
164
-
165
-
166
-
167
-
168
-
169
-
170
-
171
-
172
 |
 |

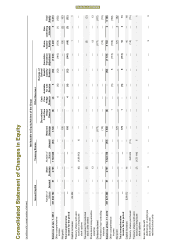
DELHAIZE GROUP FINANCIAL STATEMENTS 2014 // 75
Tax payment for restricted
stock units vested
—
—
(5)
—
—
—
—
—
—
—
—
(5)
—
(5)
Share
-
based compensation
expense
—
—
16
—
—
—
—
—
—
—
—
16
—
16
Dividend declared
—
—
—
—
—
(142)
—
—
—
—
—
(142)
—
(142)
Balances at Dec. 31, 2013
102 449 570
51
2 814
1 200 943
(66)
3 675
(8)
—
(5)
(42)
(1 351)
5 068
5
5 073
Other comprehensive
income
—
—
—
—
—
—
(1)
—
2
(14)
434
421
—
421
Net profit
—
—
—
—
—
89
—
—
—
—
—
89
1
90
Total comprehensive
income for the period
—
—
—
—
—
89
(1)
—
2
(14)
434
510
1
511
Capital increases
369 483
—
14
—
—
—
—
—
—
—
—
14
—
14
Treasury shares purchased
—
—
—
190 139
(10)
—
—
—
—
—
—
(10)
—
(10)
Treasury shares
sold upon
exercise of employee
stock options
—
—
(2)
(275 988)
13
—
—
—
—
—
—
11
—
11
Excess tax benefit
(deficiency) on
employee
stock options and
restricted stock units
—
—
1
—
—
—
—
—
—
—
—
1
—
1
Tax payment for restricted
stock units vested
—
—
(1)
—
—
—
—
—
—
—
—
(1)
—
(1)
Share-based compensation
expense
—
—
12
—
—
—
—
—
—
—
—
12
—
12
Dividend declared
—
—
—
—
—
(158)
—
—
—
—
—
(158)
—
(158)
Balances at Dec. 31, 2014
102 819 053
51
2 838
1 115 094
(63)
3 606
(9)
—
(3)
(56)
(917)
5 447
6
5 453
Delhaize Group Annual Report 2014 • 77