Food Lion 2014 Annual Report Download - page 161
Download and view the complete annual report
Please find page 161 of the 2014 Food Lion annual report below. You can navigate through the pages in the report by either clicking on the pages listed below, or by using the keyword search tool below to find specific information within the annual report.-
 1
1 -
2
-
3
-
4
-
5
-
6
-
7
-
8
-
9
-
10
-
11
-
12
-
13
-
14
-
15
-
16
-
17
-
18
-
19
-
20
-
21
-
22
-
23
-
24
-
25
-
26
-
27
-
28
-
29
-
30
-
31
-
32
-
33
-
34
-
35
-
36
-
37
-
38
-
39
-
40
-
41
-
42
-
43
-
44
-
45
-
46
-
47
-
48
-
49
-
50
-
51
-
52
-
53
-
54
-
55
-
56
-
57
-
58
-
59
-
60
-
61
-
62
-
63
-
64
-
65
-
66
-
67
-
68
-
69
-
70
-
71
-
72
-
73
-
74
-
75
-
76
-
77
-
78
-
79
-
80
-
81
-
82
-
83
-
84
-
85
-
86
-
87
-
88
-
89
-
90
-
91
-
92
-
93
-
94
-
95
-
96
-
97
-
98
-
99
-
100
-
101
-
102
-
103
-
104
-
105
-
106
-
107
-
108
-
109
-
110
-
111
-
112
-
113
-
114
-
115
-
116
-
117
-
118
-
119
-
120
-
121
-
122
-
123
-
124
-
125
-
126
-
127
-
128
-
129
-
130
-
131
-
132
-
133
-
134
-
135
-
136
-
137
-
138
-
139
-
140
-
141
-
142
-
143
-
144
-
145
-
146
-
147
-
148
-
149
-
150
-
 151
151 -
 152
152 -
 153
153 -
 154
154 -
 155
155 -
 156
156 -
 157
157 -
 158
158 -
 159
159 -
 160
160 -
 161
161 -
 162
162 -
 163
163 -
 164
164 -
 165
165 -
 166
166 -
 167
167 -
 168
168 -
 169
169 -
 170
170 -
 171
171 -
172
 |
 |

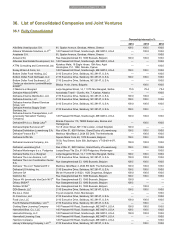
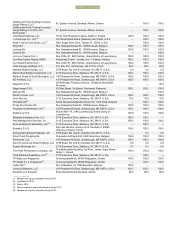
DELHAIZE GROUP FINANCIAL STATEMENTS 2014 // 157
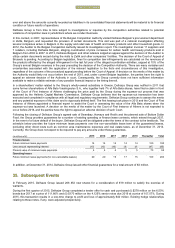
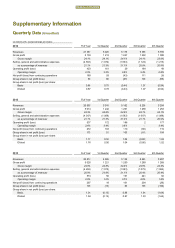
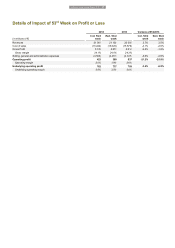
Details of Impact of 53rd Week on Profit or Loss
2014
2013
Variance 2014/2013
(in millions of €)
Incl. 53rd
week
Excl. 53rd
week
Incl. 53rd
week
Excl. 53rd
week
Revenues
21 361
21 102
20 593
3.7%
2.5%
Cost of sales
(16 222)
(16 029)
(15 579)
-
4.1%
-2.9
%
Gross Profit
5 139
5 073
5 014
-2.5%
-1.2%
Gross margin
24.1%
24.0%
24.3%
Selling, general and administrative expenses
(4 503)
(4 461)
(4 347)
-3.6%
-2.6%
Operating profit
423
399
537
-21.2%
-25.8%
Operating margin
2.0%
1.9%
2.6%
Underlying operating profit
762
737
789
-3.4%
-6.5%
Underlying operating margin
3.6%
3.5%
3.8%
Delhaize Group Annual Report 2014 • 159