Food Lion 2014 Annual Report Download - page 38
Download and view the complete annual report
Please find page 38 of the 2014 Food Lion annual report below. You can navigate through the pages in the report by either clicking on the pages listed below, or by using the keyword search tool below to find specific information within the annual report.-
 1
1 -
2
-
3
-
4
-
5
-
6
-
7
-
8
-
9
-
10
-
11
-
12
-
13
-
14
-
15
-
16
-
17
-
18
-
19
-
20
-
21
-
22
-
23
-
24
-
25
-
26
-
27
-
 28
28 -
 29
29 -
 30
30 -
 31
31 -
 32
32 -
 33
33 -
 34
34 -
 35
35 -
 36
36 -
 37
37 -
 38
38 -
 39
39 -
 40
40 -
 41
41 -
 42
42 -
 43
43 -
 44
44 -
 45
45 -
 46
46 -
 47
47 -
 48
48 -
49
-
50
-
51
-
52
-
53
-
54
-
55
-
56
-
57
-
58
-
59
-
60
-
61
-
62
-
63
-
64
-
65
-
66
-
67
-
68
-
69
-
70
-
71
-
72
-
73
-
74
-
75
-
76
-
77
-
78
-
79
-
80
-
81
-
82
-
83
-
84
-
85
-
86
-
87
-
88
-
89
-
90
-
91
-
92
-
93
-
94
-
95
-
96
-
97
-
98
-
99
-
100
-
101
-
102
-
103
-
104
-
105
-
106
-
107
-
108
-
109
-
110
-
111
-
112
-
113
-
114
-
115
-
116
-
117
-
118
-
119
-
120
-
121
-
122
-
123
-
124
-
125
-
126
-
127
-
128
-
129
-
130
-
131
-
132
-
133
-
134
-
135
-
136
-
137
-
138
-
139
-
140
-
141
-
142
-
143
-
144
-
145
-
146
-
147
-
148
-
149
-
150
-
151
-
152
-
153
-
154
-
155
-
156
-
157
-
158
-
159
-
160
-
161
-
162
-
163
-
164
-
165
-
166
-
167
-
168
-
169
-
170
-
171
-
172
 |
 |
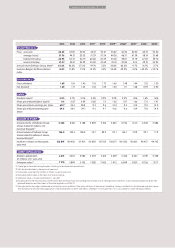
Cash Flow Statement and
Balance Sheet
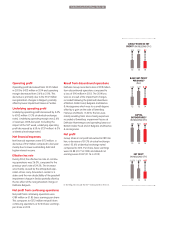
Net cash provided by operating
activities
In 2014, net cash provided by operating
activities was €1 147 million, a decrease of
€38 million compared to 2013, mainly as a
result of lower EBITDA (€93 million, both from
continuing and discontinued operations),
higher tax payments (€26 million), partially off-
set by a favorable change in operating assets
and liabilities (€76 million).
Free cash flow
As a result of capital expenditures of €606 mil-
lion (€565 million in 2013), €167 million of
proceeds related to divestitures and contin-
ued working capital control, we generated
€757 million free cash flow in 2014 (€669 mil-
lion in 2013).
Net debt
Compared to year-end 2013, net debt
decreased by €476 million to €1.0 billion
mainly as a result of €757 million of free cash
flow generation which was partially offset by
the payment of the dividend in the second
quarter and the strengthening of the U.S.
dollar.
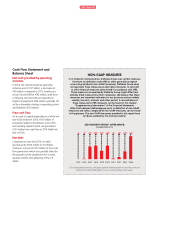
NON-GAAP MEASURES
In its financial communication, Delhaize Group uses certain measures
that have no definition under IFRS or other generally accepted
accounting standards (non-GAAP measures). Delhaize Group does
not represent these measures as alternative measures to net profit
or other financial measures determined in accordance with IFRS.
These measures as reported by Delhaize Group might differ from
similarly titled measures by other companies. We believe that these
measures are important indicators for our business and are widely
used by investors, analysts and other parties. A reconciliation of
these measures to IFRS measures can be found in the chapter
“Supplementary Information” of the Financial Statements
(http://annualreport.delhaizegroup.com). A definition of non-GAAP
measures and ratios composed of non-GAAP measures can be found
in the glossary. The non-GAAP measures provided in this report have
not been audited by the statutory auditor.
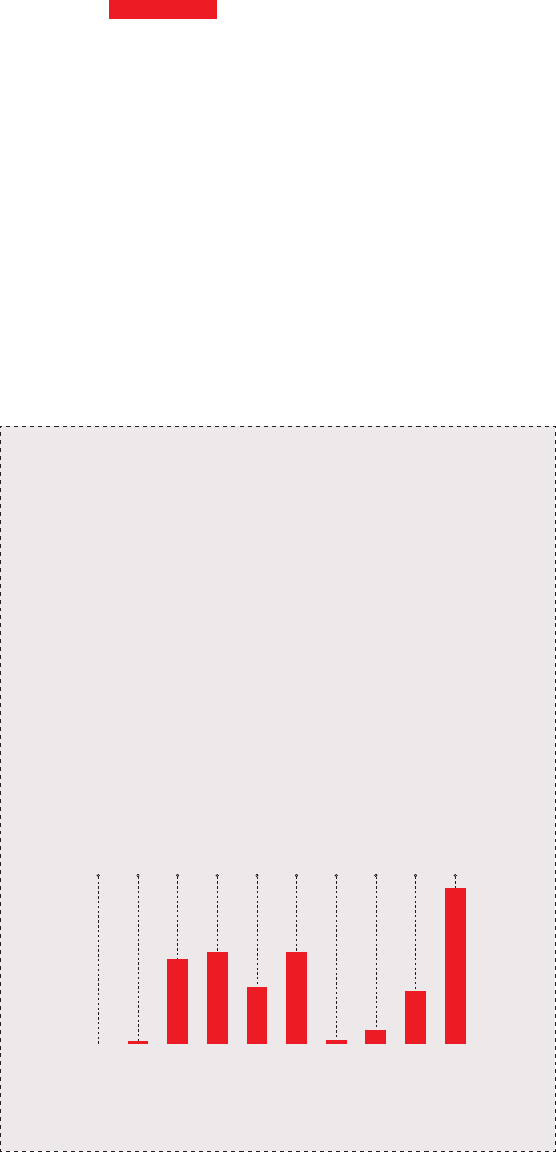
DEBT MATURITY PROFILE
(1)
(AFTER SWAPS)
(IN MILLIONS OF €)
(1) Excluding finance leases; principal payments (related premiums and discounts not
taken into account) after effect of cross-currency interest rate swaps.
PERFORMANCE
0
2015
371
2017
247
2019
10
2024
229
2031
8
2016
400
2018
400
2020
58
2027
681
2040