Food Lion 2014 Annual Report Download - page 118
Download and view the complete annual report
Please find page 118 of the 2014 Food Lion annual report below. You can navigate through the pages in the report by either clicking on the pages listed below, or by using the keyword search tool below to find specific information within the annual report.-
 1
1 -
2
-
3
-
4
-
5
-
6
-
7
-
8
-
9
-
10
-
11
-
12
-
13
-
14
-
15
-
16
-
17
-
18
-
19
-
20
-
21
-
22
-
23
-
24
-
25
-
26
-
27
-
28
-
29
-
30
-
31
-
32
-
33
-
34
-
35
-
36
-
37
-
38
-
39
-
40
-
41
-
42
-
43
-
44
-
45
-
46
-
47
-
48
-
49
-
50
-
51
-
52
-
53
-
54
-
55
-
56
-
57
-
58
-
59
-
60
-
61
-
62
-
63
-
64
-
65
-
66
-
67
-
68
-
69
-
70
-
71
-
72
-
73
-
74
-
75
-
76
-
77
-
78
-
79
-
80
-
81
-
82
-
83
-
84
-
85
-
86
-
87
-
88
-
89
-
90
-
91
-
92
-
93
-
94
-
95
-
96
-
97
-
98
-
99
-
100
-
101
-
102
-
103
-
104
-
105
-
106
-
107
-
 108
108 -
 109
109 -
 110
110 -
 111
111 -
 112
112 -
 113
113 -
 114
114 -
 115
115 -
 116
116 -
 117
117 -
 118
118 -
 119
119 -
 120
120 -
 121
121 -
 122
122 -
 123
123 -
 124
124 -
 125
125 -
 126
126 -
 127
127 -
 128
128 -
129
-
130
-
131
-
132
-
133
-
134
-
135
-
136
-
137
-
138
-
139
-
140
-
141
-
142
-
143
-
144
-
145
-
146
-
147
-
148
-
149
-
150
-
151
-
152
-
153
-
154
-
155
-
156
-
157
-
158
-
159
-
160
-
161
-
162
-
163
-
164
-
165
-
166
-
167
-
168
-
169
-
170
-
171
-
172
 |
 |

114 // DELHAIZE GROUP FINANCIAL STATEMENTS 2014
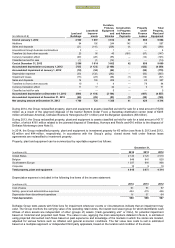
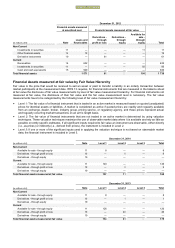
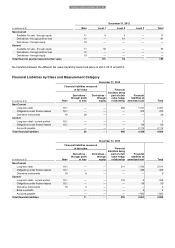
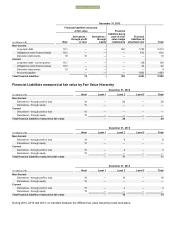
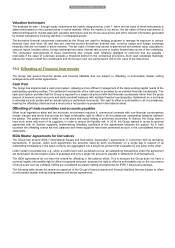
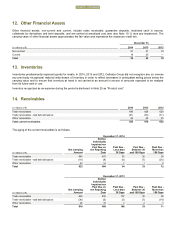
12. Other Financial Assets
Other financial assets, non-current and current, include notes receivable, guarantee deposits, restricted cash in escrow,
collaterals for derivatives and term deposits, and are carried at amortized cost (see also Note 10.1), less any impairment. The
carrying value of other financial assets approximates the fair value and represents the maximum credit risk.
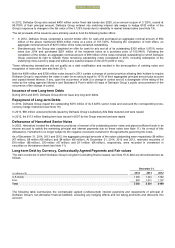
December 31,
(in millions of €)
2014
2013
2012
Non
-current
21
21
19
Current
18
25
—
Total
39
46
19
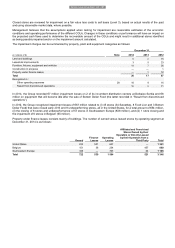
13. Inventories
Inventories predominantly represent goods for resale. In 2014, 2013 and 2012, Delhaize Group did not recognize any (or reverse
any previously recognized) material write-downs of inventory in order to reflect decreases in anticipated selling prices below the
carrying value and to ensure that inventory at hand is not carried at an amount in excess of amounts expected to be realized
from its future sale or use.
Inventory recognized as an expense during the period is disclosed in Note 25 as “Product cost.”
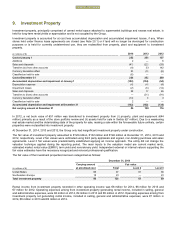
14. Receivables
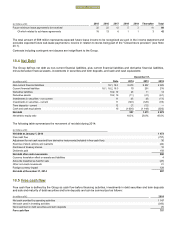
(in millions of €)
2014
2013
2012
Trade receivables
640
628
628
Trade receivables - bad debt allowance
(41)
(36)
(31)
Other receivables
24
26
35
Total current receivables
623
618
632
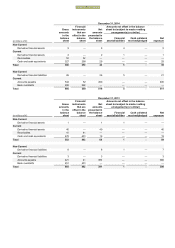
The aging of the current receivables is as follows:
December 31, 2014
(in millions of €)
Net Carrying
Amount
Neither
Individually
Impaired nor
Past Due on
the Reporting
Date
Past Due
-
Less than
30 Days
Past Due
-
Between 30
and 180 Days
Past Due
-
More than
180 Days
Trade receivables
640
478
93
39
30
Trade receivables - bad debt allowance
(41)
(8)
(6)
(7)
(20)
Other receivables
24
14
7
1
2
Total
623
484
94
33
12
December 31, 2013
(in millions of €)
Net Carrying
Amount
Neither
Ind
ividually
Impaired nor
Past Due on
the Reporting
Date
Past Due
-
Less than
30 Days
Past Due
-
Between 30
and 180 Days
Past Due
-
More than
180 Days
Trade receivables
628
455
107
38
28
Trade receivables - bad debt allowance
(36)
(6)
(5)
(7)
(18)
Other receivables
26
19
4
2
1
Total
618
468
106
33
11
FINANCIAL STATEMENTS