Food Lion 2014 Annual Report Download - page 158
Download and view the complete annual report
Please find page 158 of the 2014 Food Lion annual report below. You can navigate through the pages in the report by either clicking on the pages listed below, or by using the keyword search tool below to find specific information within the annual report.-
 1
1 -
2
-
3
-
4
-
5
-
6
-
7
-
8
-
9
-
10
-
11
-
12
-
13
-
14
-
15
-
16
-
17
-
18
-
19
-
20
-
21
-
22
-
23
-
24
-
25
-
26
-
27
-
28
-
29
-
30
-
31
-
32
-
33
-
34
-
35
-
36
-
37
-
38
-
39
-
40
-
41
-
42
-
43
-
44
-
45
-
46
-
47
-
48
-
49
-
50
-
51
-
52
-
53
-
54
-
55
-
56
-
57
-
58
-
59
-
60
-
61
-
62
-
63
-
64
-
65
-
66
-
67
-
68
-
69
-
70
-
71
-
72
-
73
-
74
-
75
-
76
-
77
-
78
-
79
-
80
-
81
-
82
-
83
-
84
-
85
-
86
-
87
-
88
-
89
-
90
-
91
-
92
-
93
-
94
-
95
-
96
-
97
-
98
-
99
-
100
-
101
-
102
-
103
-
104
-
105
-
106
-
107
-
108
-
109
-
110
-
111
-
112
-
113
-
114
-
115
-
116
-
117
-
118
-
119
-
120
-
121
-
122
-
123
-
124
-
125
-
126
-
127
-
128
-
129
-
130
-
131
-
132
-
133
-
134
-
135
-
136
-
137
-
138
-
139
-
140
-
141
-
142
-
143
-
144
-
145
-
146
-
147
-
 148
148 -
 149
149 -
 150
150 -
 151
151 -
 152
152 -
 153
153 -
 154
154 -
 155
155 -
 156
156 -
 157
157 -
 158
158 -
 159
159 -
 160
160 -
 161
161 -
 162
162 -
 163
163 -
 164
164 -
 165
165 -
 166
166 -
 167
167 -
 168
168 -
169
-
170
-
171
-
172
 |
 |

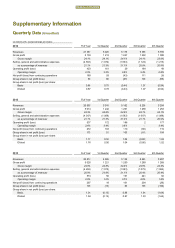
154 // DELHAIZE GROUP FINANCIAL STATEMENTS 2014
Supplementary Information
Quarterly Data (Unaudited)
(in millions of €, except earnings per share)
2014
Full Year
1st Quarter
2nd Quarter
3rd Quarter
4th Quarter
Revenues
21 361
5 025
5 176
5 365
5 795
Gross profit
5 139
1 212
1 247
1 292
1 388
Gross margin
24.1%
24
.1%
24.1%
24.1%
23.9%
Selling, general and administrative expenses
(4 503)
(1 072)
(1 094)
(1 124)
(1 213)
as a percentage of revenues
21.1%
21.3%
21.1%
20.9%
20.9%
Operating profit (loss)
423
161
29
184
49
Operating margin
2.0%
3.2
%
0.6%
3.4%
0.8%
Net profit (loss) from continuing operations
189
93
(43)
111
28
Group share in net profit (loss)
89
80
(45)
109
(55)
Group share in net profit (loss) per share:
Basic
0.88
0.79
(0.44)
1.07
(0.54)
Diluted
0
.87
0.78
(0.44)
1.07
(0.54)
2013
Full Year
1st Quarter
2nd Quarter
3rd Quarter
4th Quarter
Revenues
20 593
5 018
5 162
5 209
5 204
Gross profit
5 014
1 242
1 261
1 258
1 253
Gross margin
24.3%
24.8%
24.4%
24.1%
24.1%
Selling, general and administrative expenses
(4 347)
(1 069)
(1 093)
(1 097)
(1 088)
as a percentage of revenues
21.1%
21.3%
21.2%
21.1%
20.9%
Operating profit (loss)
537
172
186
2
177
Operating margin
2.6%
3.4%
3.6%
—
3.4%
Net profit (loss) from continuing operations
272
103
110
(60)
119
Group share in net profit (loss)
179
51
105
(81)
104
Group share in net profit (loss) per share:
Basic
1.77
0.50
1.04
(0.80)
1.03
Diluted
1.76
0.50
1.04
(0.80)
1.02
2012
Full Year
1st Quarter
2nd Quarter
3rd Quarter
4th Quarter
Revenues
20 514
4 926
5 136
5 245
5 207
Gross profit
5 028
1 221
1 250
1 289
1 268
Gross margin
24.5%
24.8%
24.3%
24.6%
24.4%
Selling, general and
administrative expenses
(4 292)
(1 075)
(1 083)
(1 072)
(1 062)
as a percentage of revenues
20.9%
21.8%
21.1%
20.4%
20.4%
Operating profit (loss)
574
50
191
241
92
Operating margin
2.8%
1.0%
3.7%
4.6%
1.8%
Net profit (loss) from con
tinuing operations
297
18
101
204
(26)
Group share in net profit (loss)
105
(13)
89
195
(166)
Group share in net profit (loss) per share:
Basic
1.04
(0.13)
0.88
1.94
(1.64)
Diluted
1.04
(0.13)
0.87
1.93
(1.64)
FINANCIAL STATEMENTS